Simplified Prediction Method for PGA Amplification Factors Corrected by Site Conditions
-
摘要:
地表峰值加速度(peak ground-motion acceleration,PGA)是直观反映地震动强度的一个物理量,概念清晰且工程应用方便. 场地条件校正的PGA及其校正方法是特定工程抗震设计需要解决的问题. 为此,选取日本具有地表和井下记录KiK-net台网的32个台站及地震数据,通过对实测地震数据分析,提出了一种场地校正的PGA放大系数(
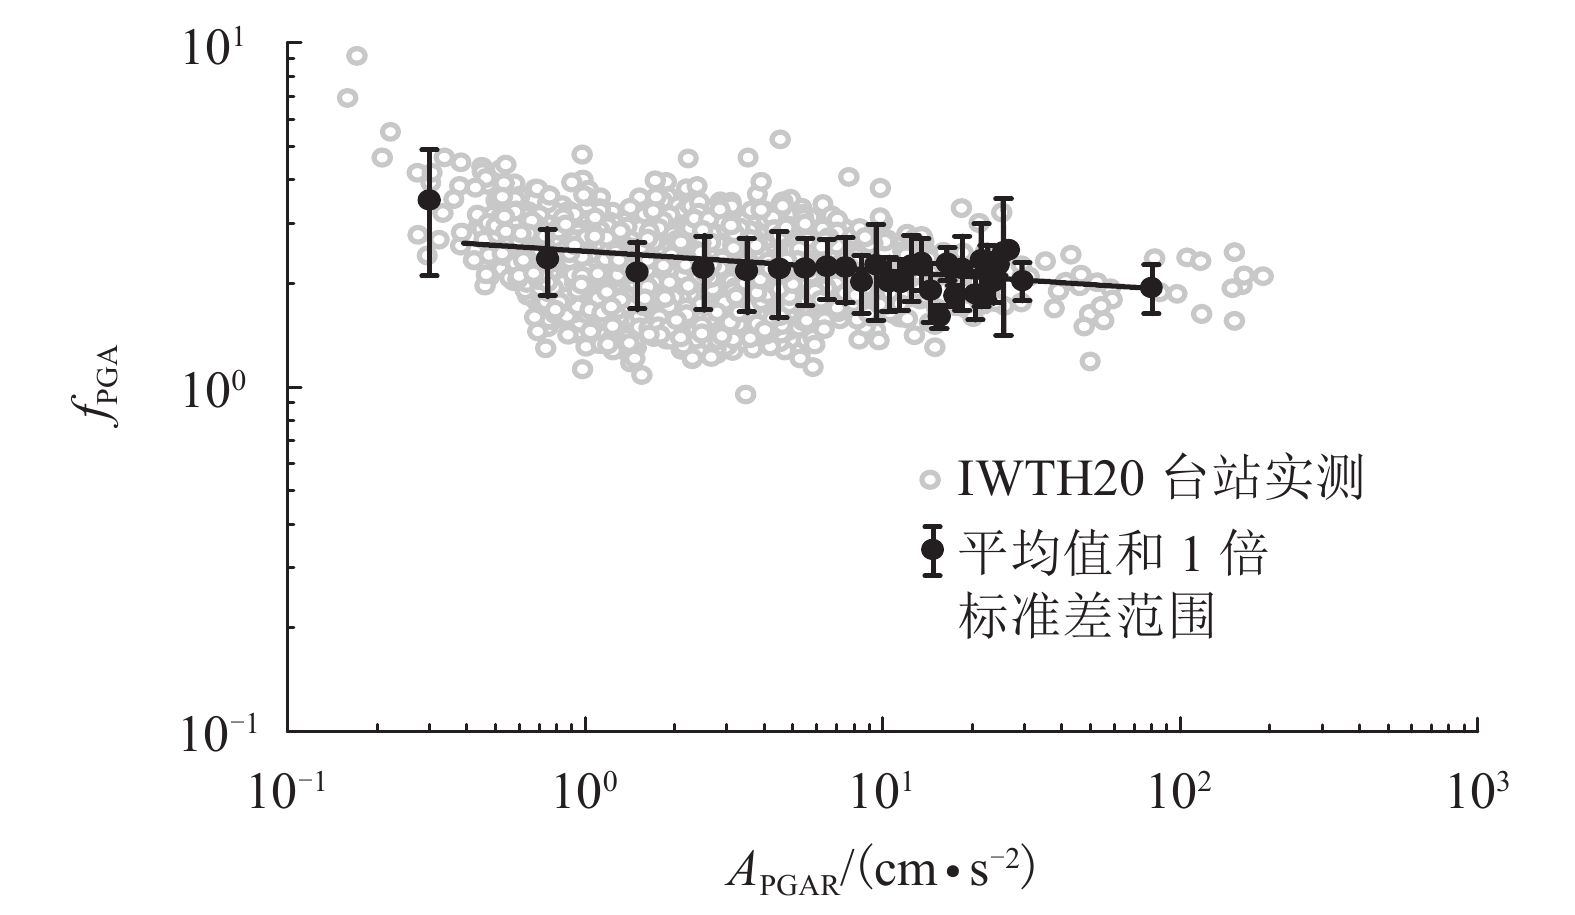
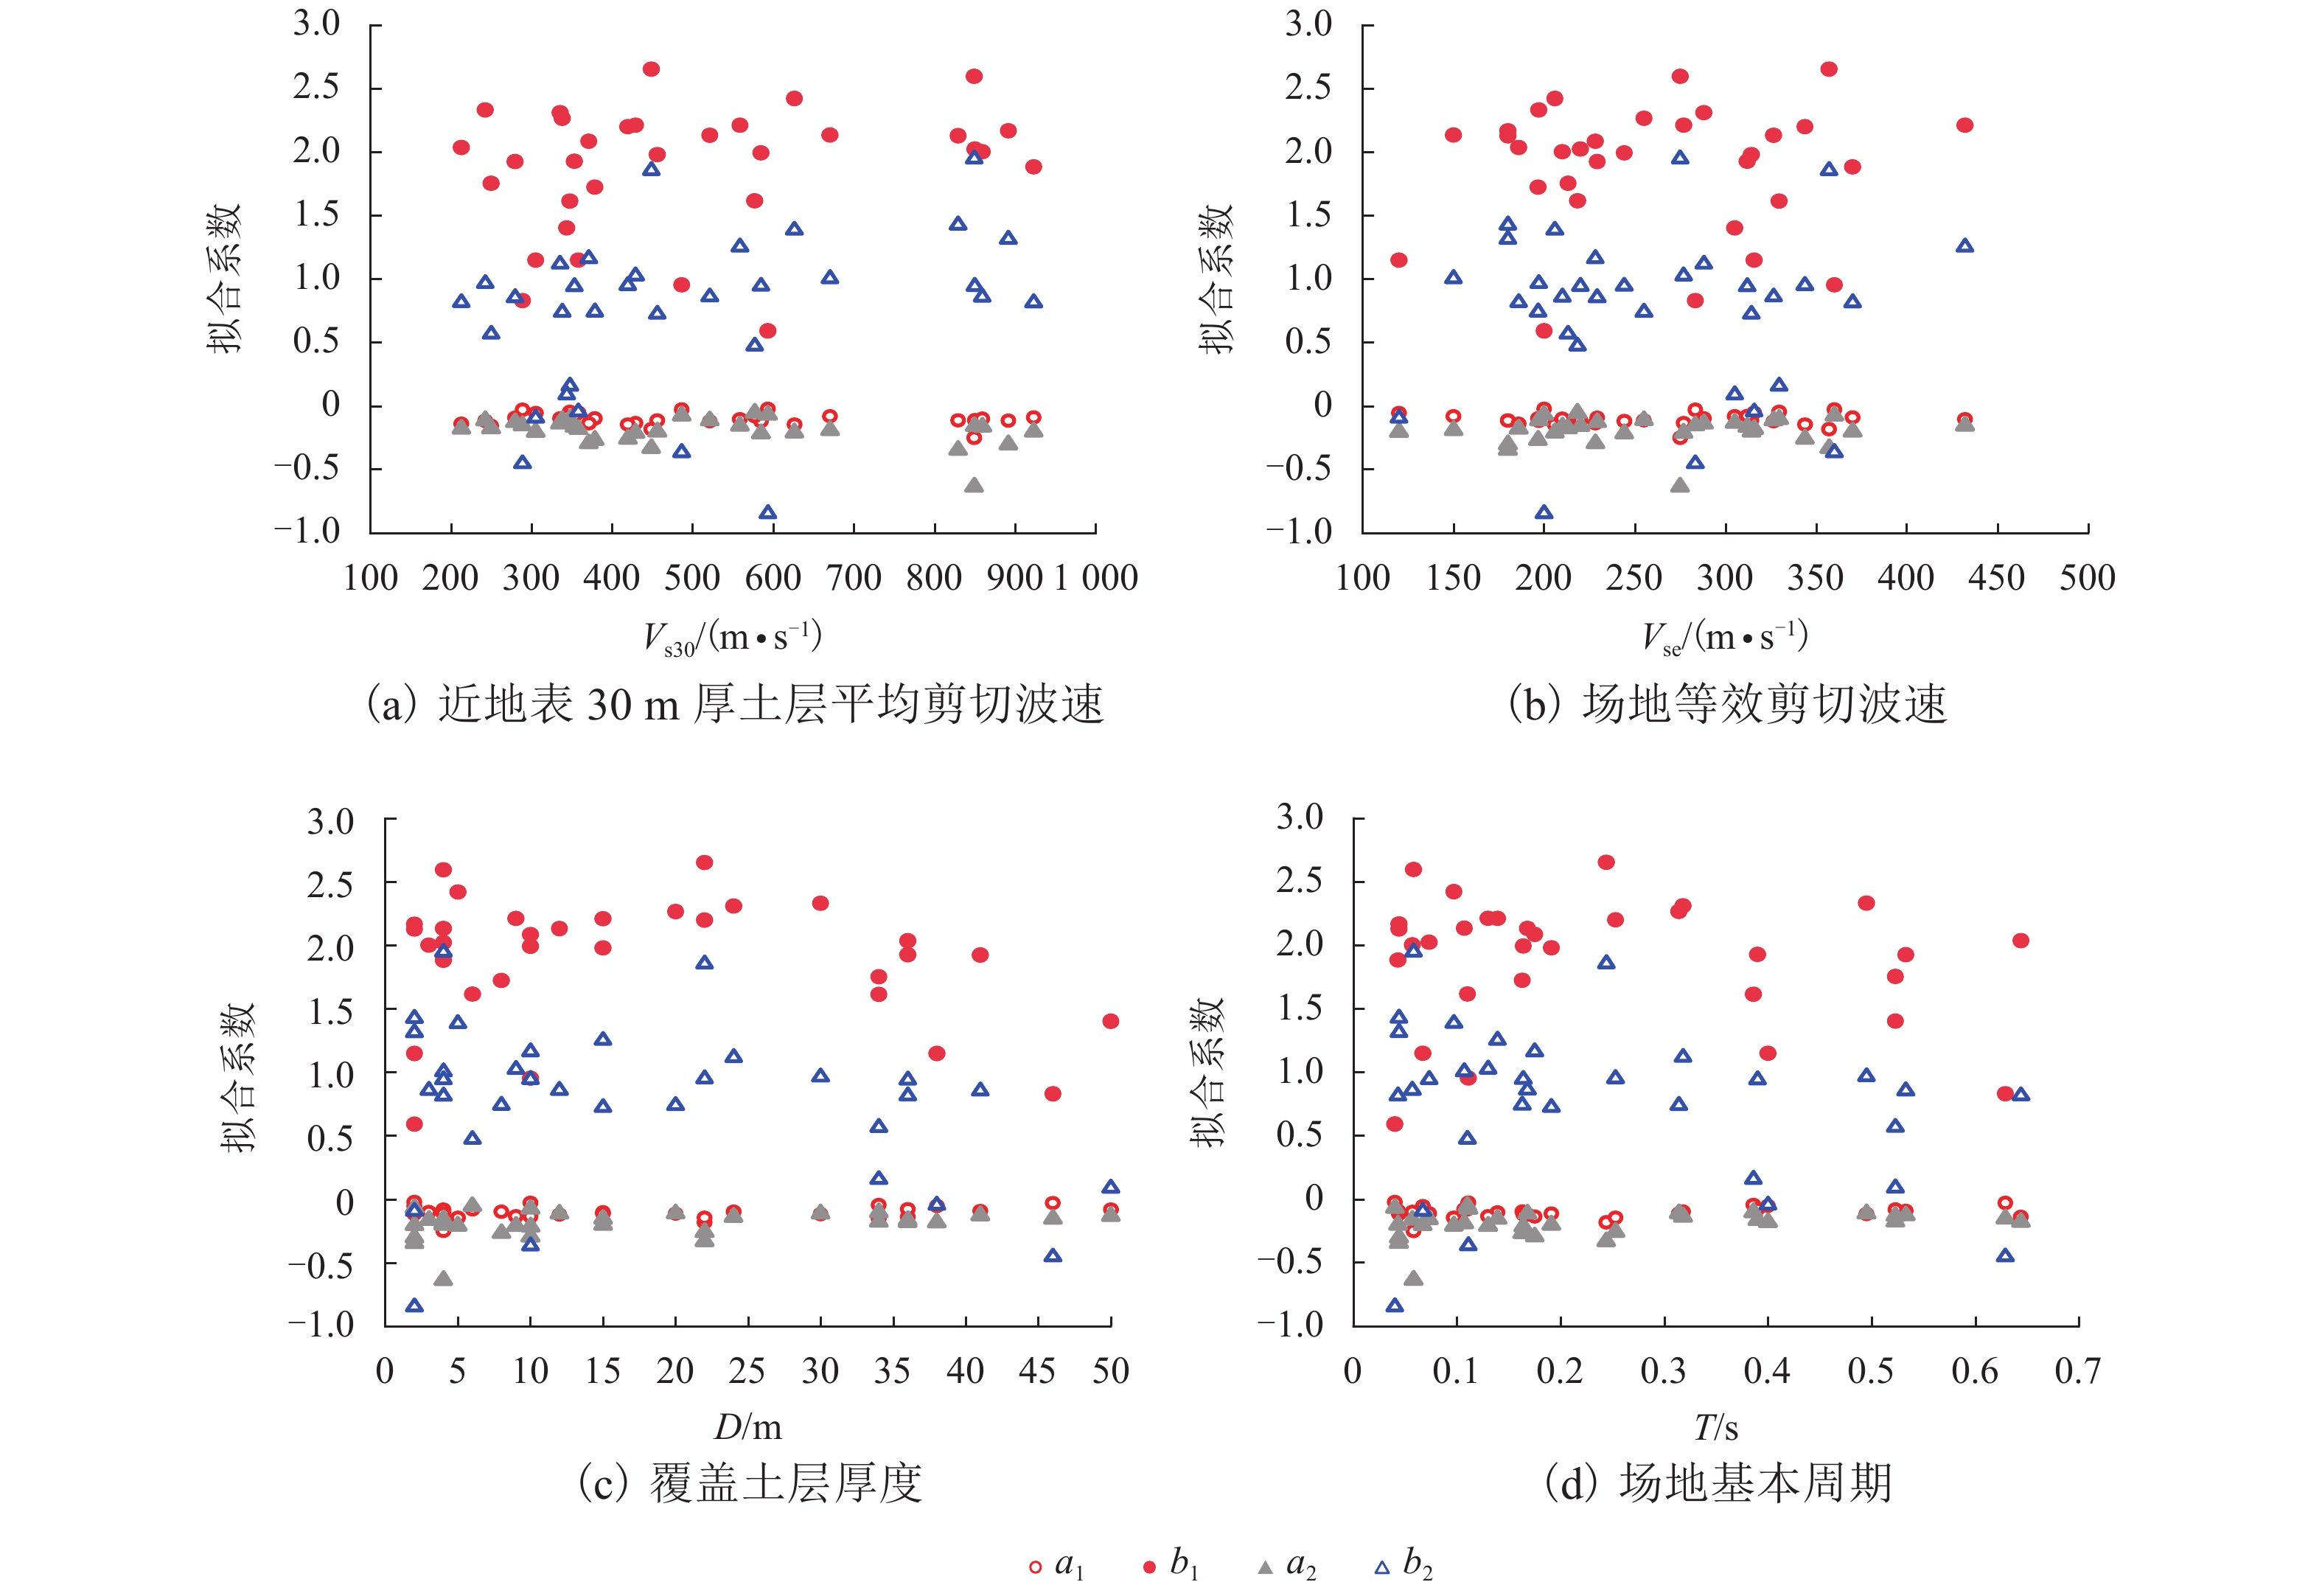
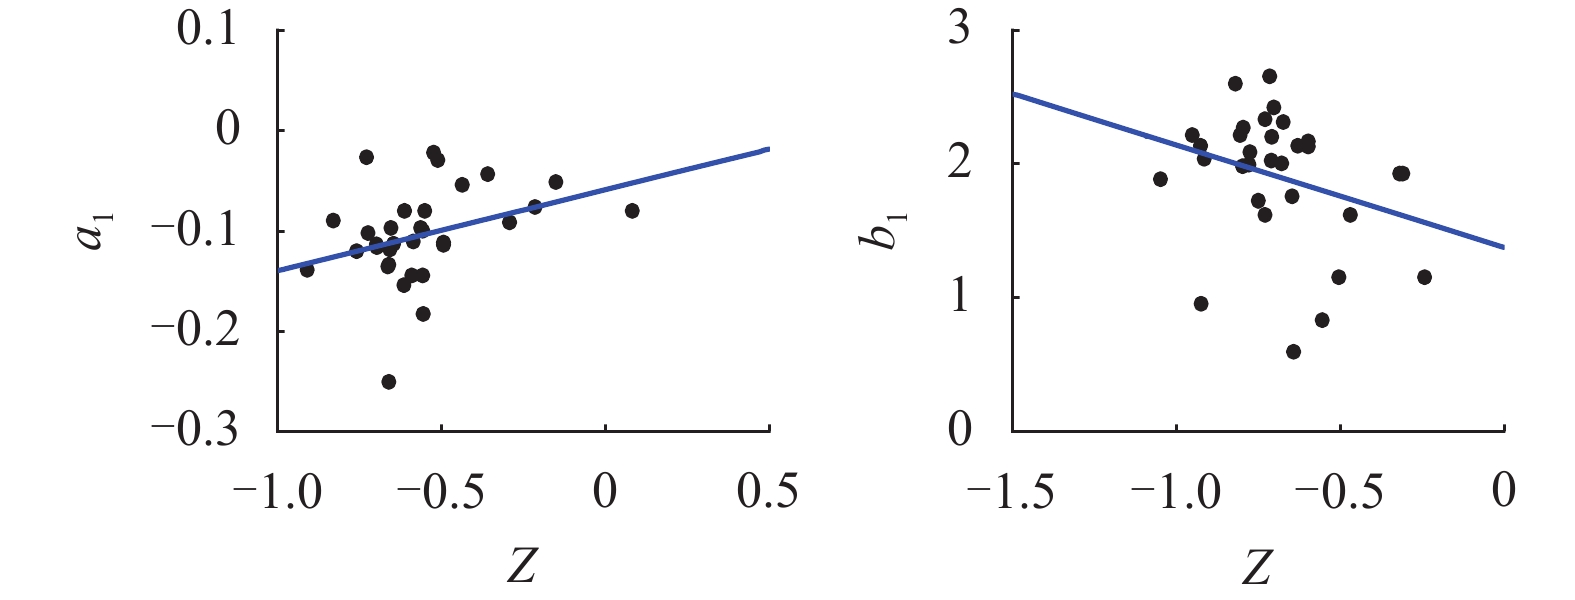
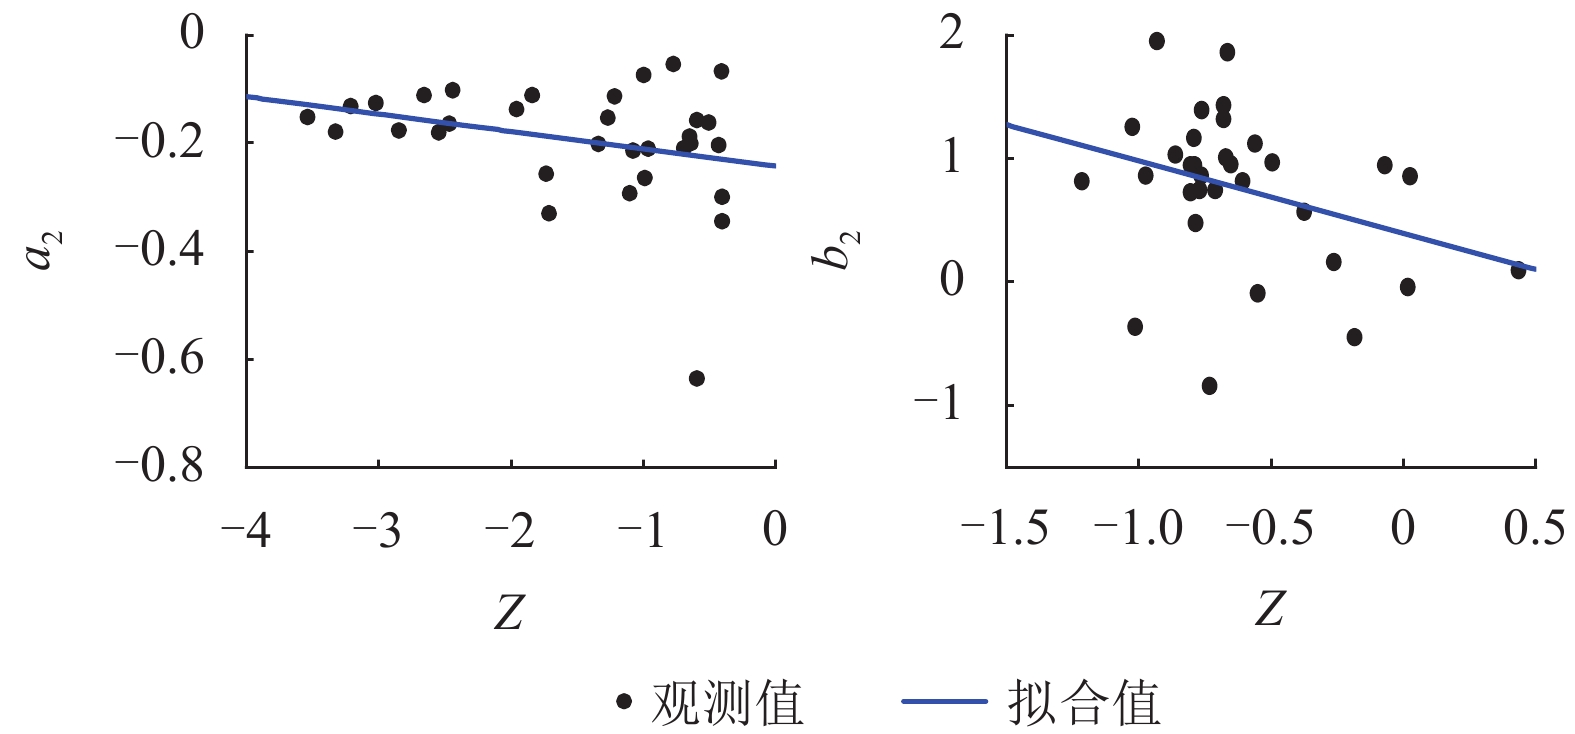
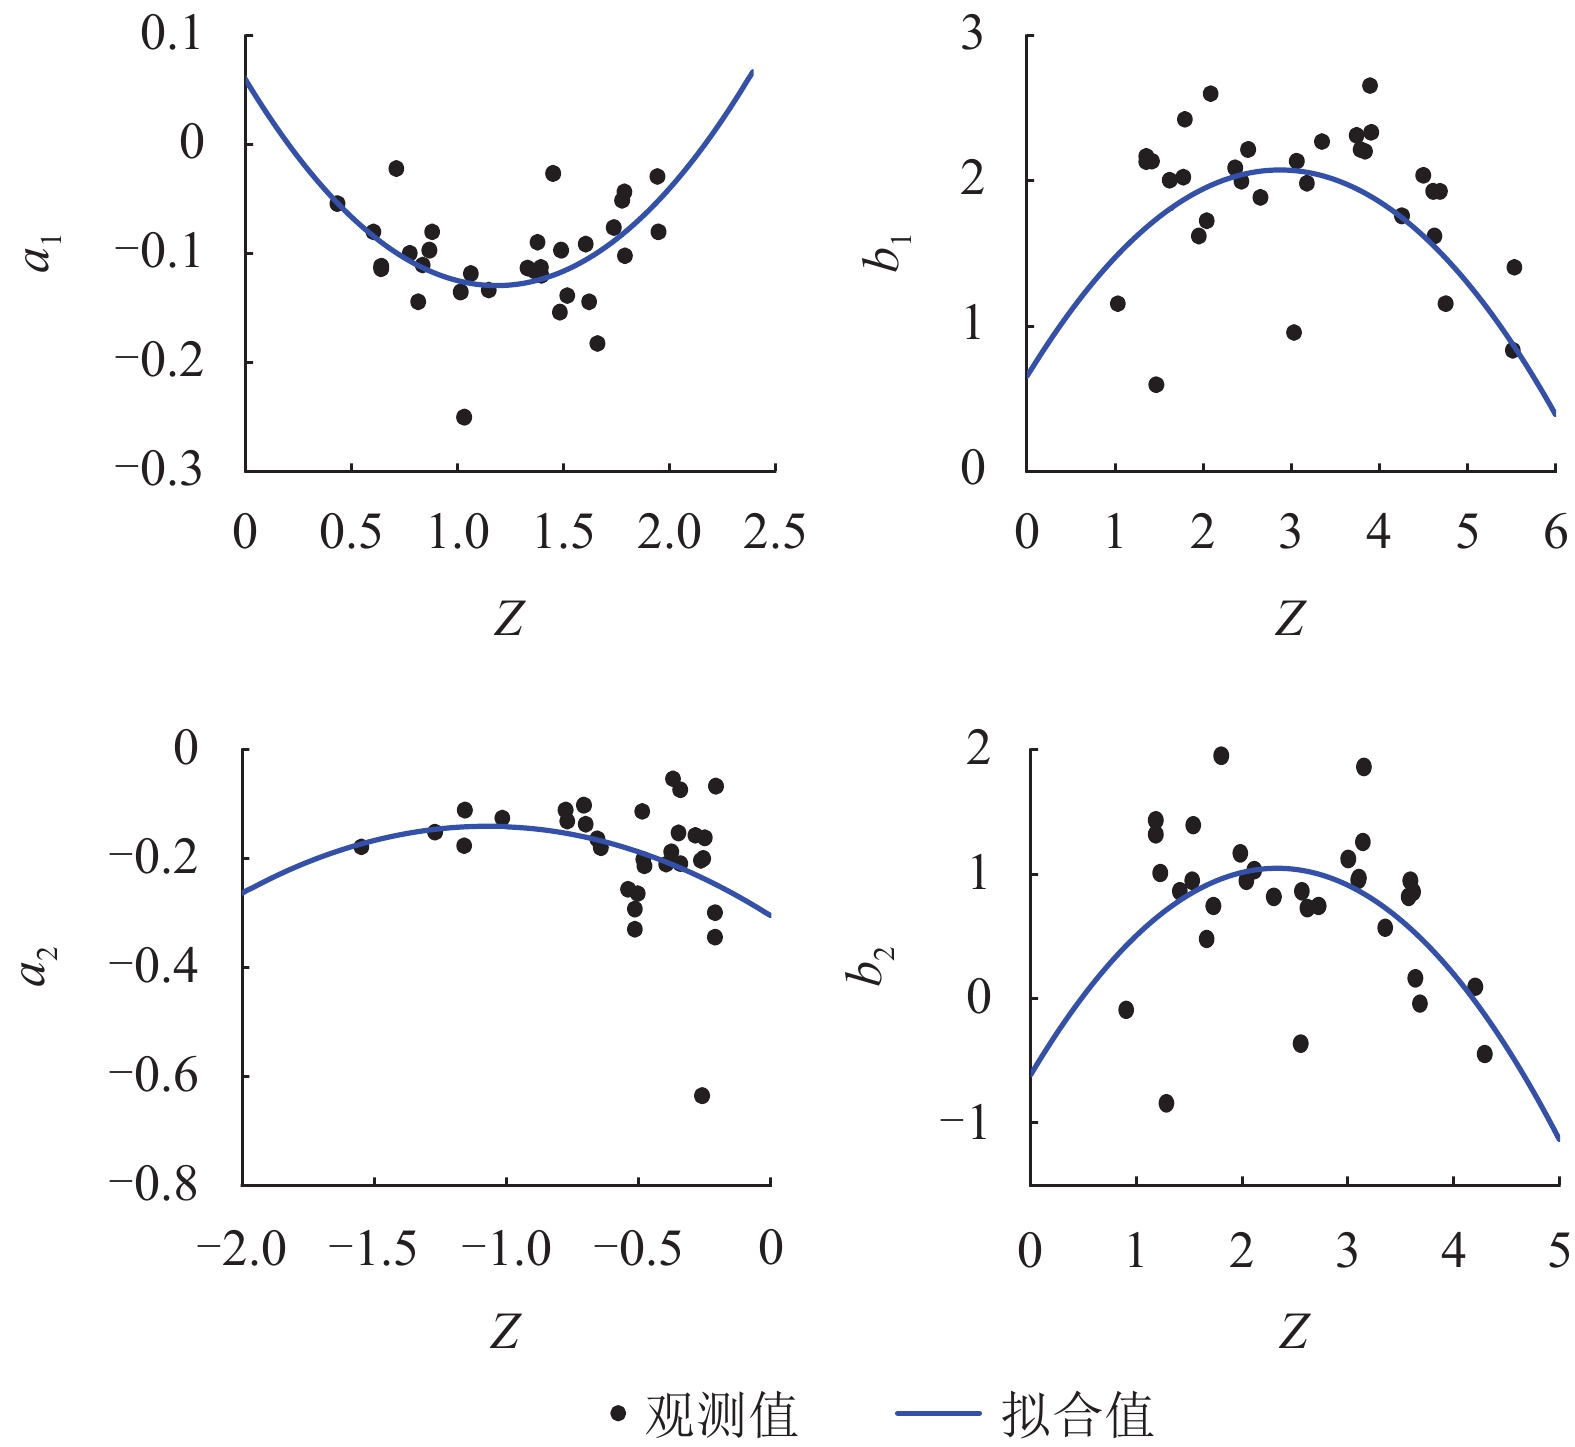
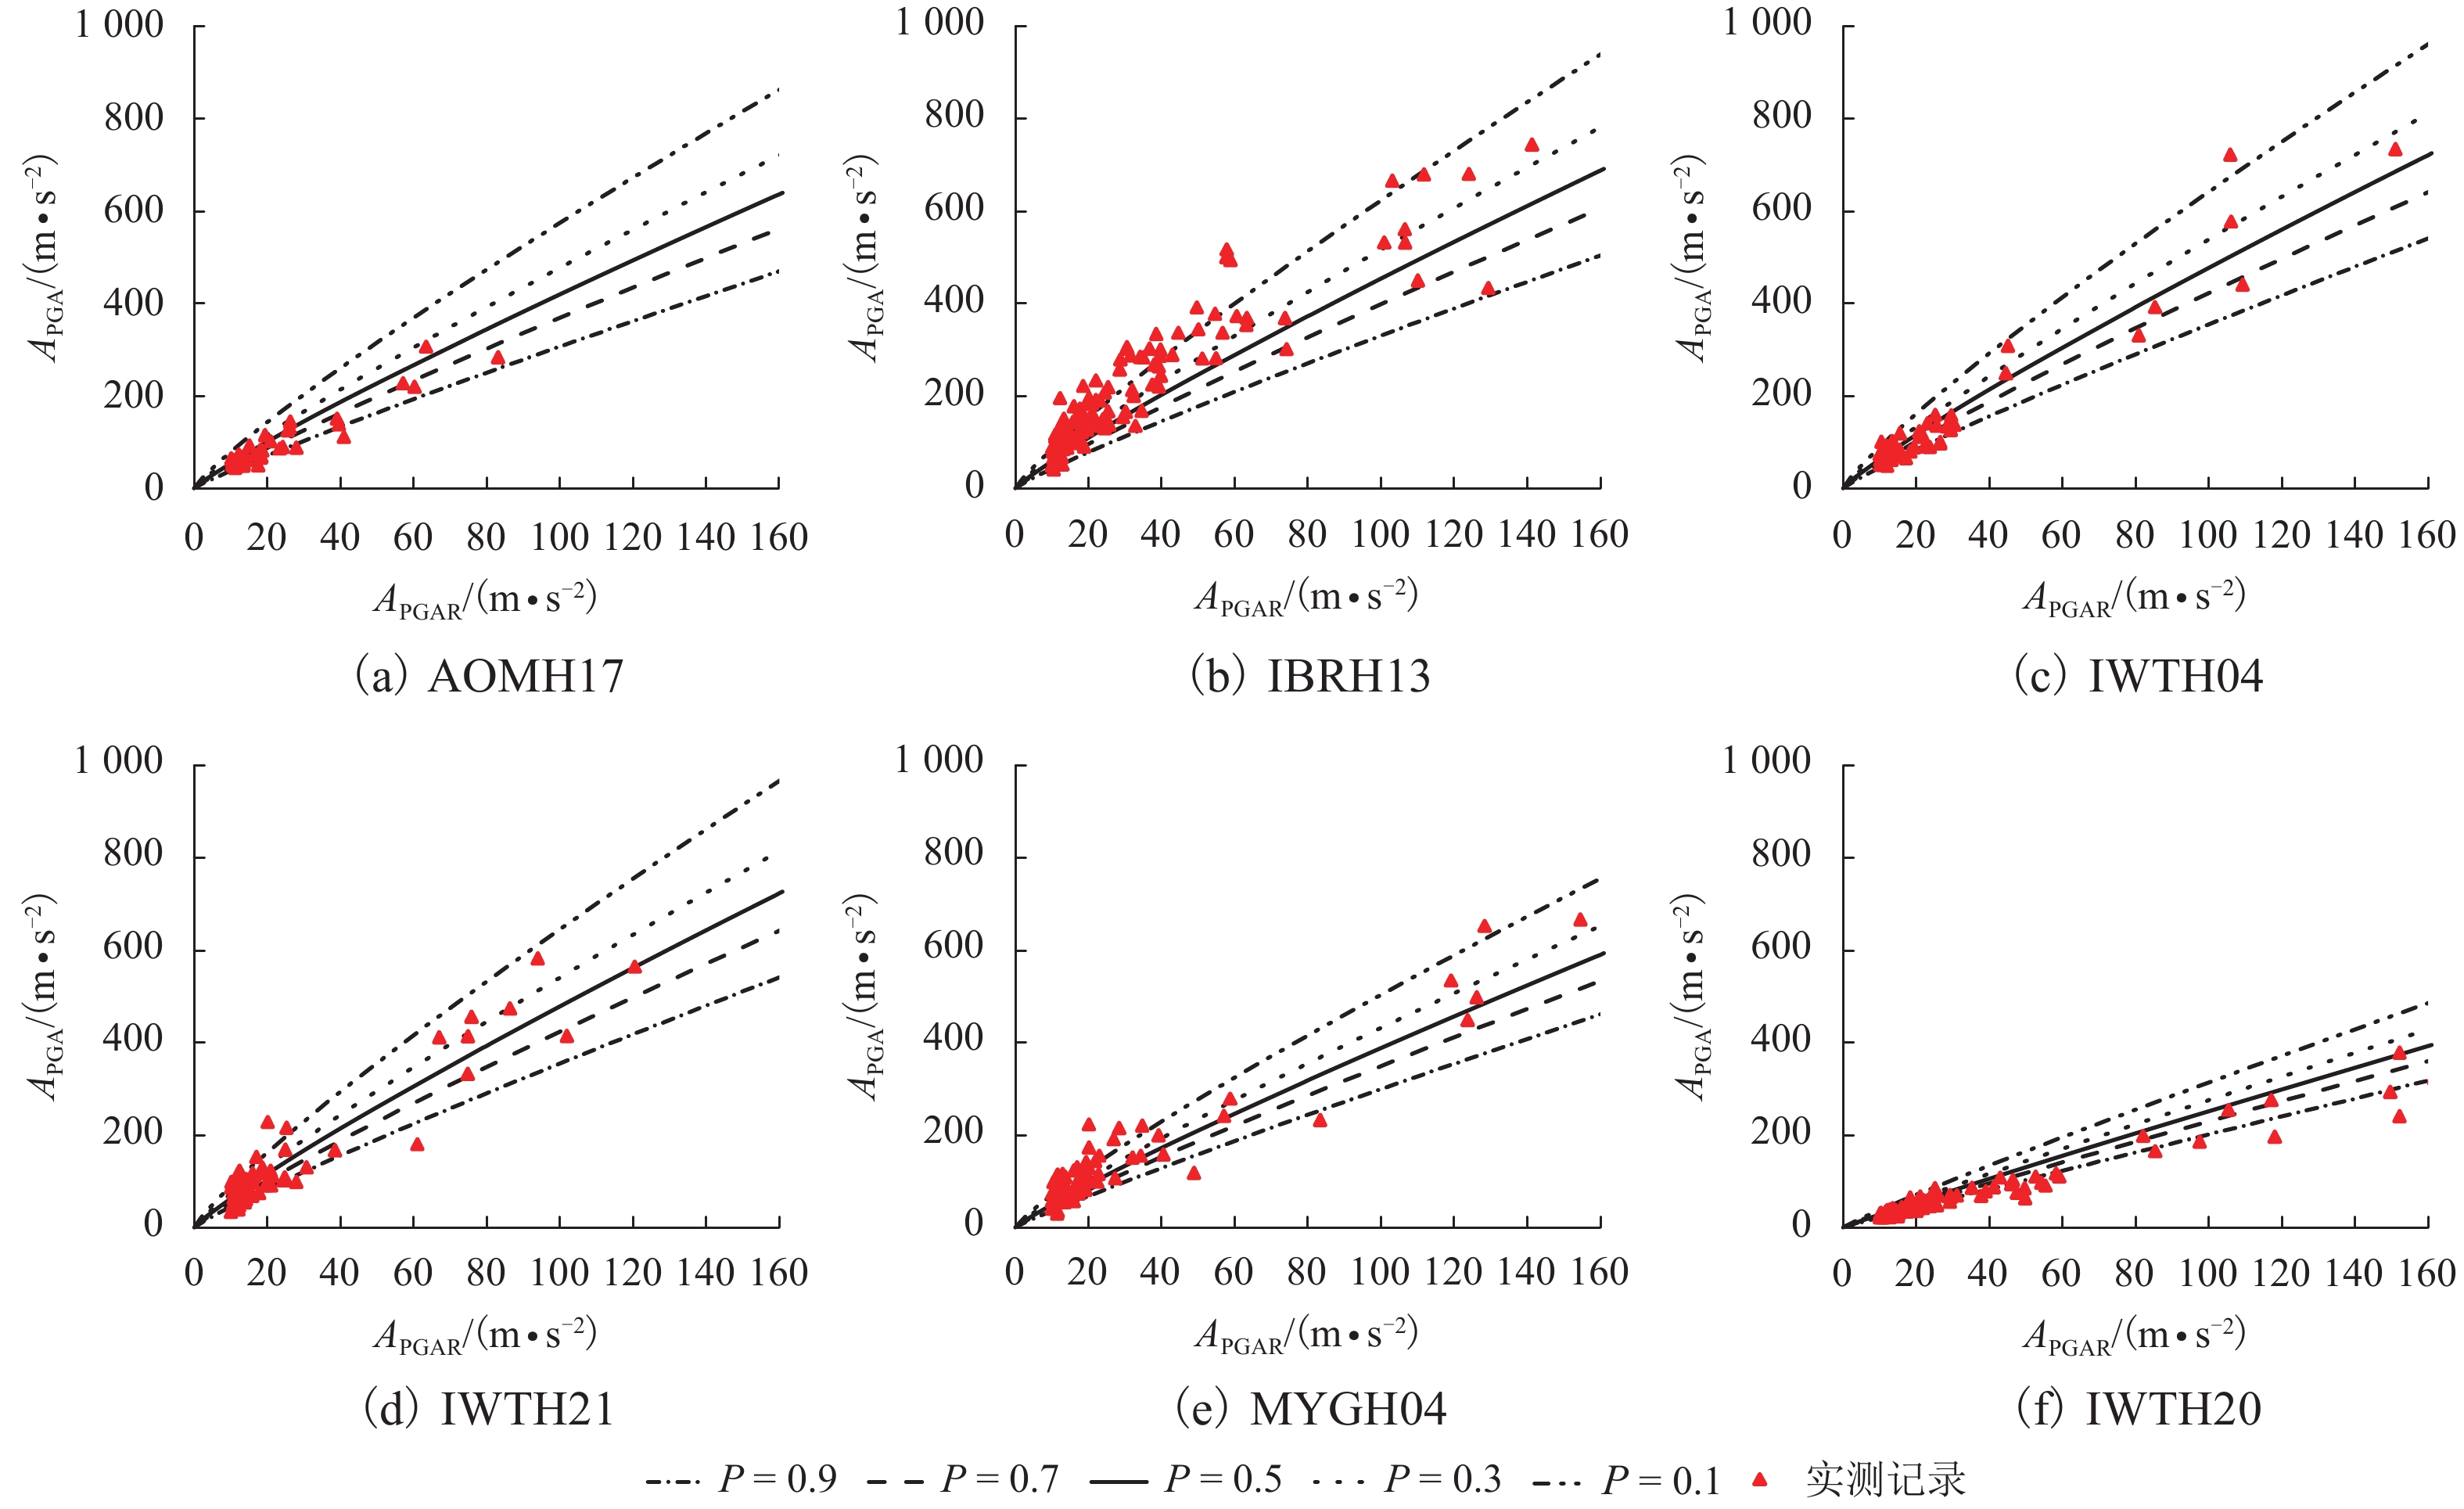
f PGA)的简化估计方法. 该方法通过数据回归给出f PGA概率密度函数参数与场地特征参数线性组合之间的线性和二次函数形式的拟合公式;并采用f PGA概率预测模型,提出了多超越概率水平地表PGA值的预测方法. 数据分析结果显示:场地f PGA具有随机不确定性,可以采用对数正态分布函数模拟,其概率密度函数的参数(均值和标准差)与单一场地特征参数相关性较小,但与场地特征参数的线性组合相关性较大. 模型预测值与实测数据吻合较好,验证了简化估计方法的可行性.Abstract:Peak ground-motion acceleration (PGA) directly reflects ground shaking intensity with the advantages in conceptual clarity and engineering application. Prediction of PGA, along with site condition correction, needs to be handled in site-specific seismic design. In this work, 32 stations and the earthquake data recorded are collected from the KiK-net strong motion array, Japan, so as to propose a simplified method to predict PGA amplification factors (
f PGA) corrected by site condition. Linear and quadratic empirical formulae of thef PGA possibility model parameters with respect to the combinations of site characteristic parameters are obtained via regression analysis. Using thef PGA model, ground surface PGA values, corrected by site conditions, can be predicted under different exceedance probability levels. Data analysis indicates thatf PGA is variable but can be simulated by a log-normally distributed function, of which mean and standard deviation are less correlated with a single site characteristic parameter but have good correlation with the linear combinations of the site characteristic parameters. The reasonable agreement between the predictions and records testifies the feasibility of the proposed method.-
Key words:
- seismic data /
- PGA amplification factor /
- site correction /
- simplified method /
- KiK-net
-
表 1 所选Kik-net台站场地特征参数
Table 1. Site characteristic parameters from KiK-net
台站 Vs30/(m•s−1) Vse/( m•s−1) D/m T/s 台站 Vs30/(m•s−1) Vse/( m•s−1) D/m T/s AOMH17 378.4 196.6 8 0.163 IWTH26 371.1 228.2 10 0.175 FKSH09 584.6 244.2 10 0.164 IWTH27 670.3 150.0 4 0.107 FKSH12 448.5 357.1 22 0.244 KMMH02 576.7 218.4 6 0.110 FKSH19 338.1 255.0 20 0.314 KMMH16 279.7 229.2 41 0.533 IBRH11 242.5 197.1 30 0.495 KSRH03 249.8 213.2 34 0.523 IBRH13 335.4 288.0 24 0.318 KSRH10 212.9 185.9 36 0.644 IBRH14 829.1 180.0 2 0.044 MYGH04 849.8 220.0 4 0.073 IBRH16 626.1 205.9 5 0.097 MYGH05 305.3 120.0 2 0.067 IBRH18 558.6 432.0 15 0.139 MYGH06 593.1 200.0 2 0.040 IWTH04 455.9 314.3 15 0.191 MYGH09 358.2 315.8 38 0.400 IWTH05 429.2 276.9 9 0.130 MYGH10 347.5 329.6 34 0.386 IWTH18 891.6 180.0 2 0.044 MYGH11 859.2 210.0 3 0.057 IWTH20 288.8 283.4 46 0.629 TCGH07 419.5 343.8 22 0.253 IWTH21 521.1 326.5 12 0.168 TCGH12 343.7 305.1 50 0.523 IWTH23 922.9 370.0 4 0.043 TCGH14 849.0 275.0 4 0.058 IWTH24 486.4 360.0 10 0.111 TKCH08 353.2 312.0 36 0.390 表 2 选取台站拟合系数
Table 2. Regressive parameters for selected station sites
台站 a1 b1 a2 b2 台站 a1 b1 a2 b2 AOMH17 −0.098 1.724 −0.266 0.741 IWTH26 −0.136 2.085 −0.294 1.163 FKSH09 −0.119 1.994 −0.215 0.945 IWTH27 −0.081 2.134 −0.189 1.005 FKSH12 −0.183 2.654 −0.331 1.855 KMMH02 −0.081 1.617 −0.054 0.473 FKSH19 −0.114 2.266 −0.111 0.740 KMMH16 −0.092 1.924 −0.127 0.854 IBRH11 −0.117 2.332 −0.112 0.966 KSRH03 −0.155 1.754 −0.177 0.567 IBRH13 −0.098 2.311 −0.138 1.118 KSRH10 −0.139 2.036 −0.179 0.816 IBRH14 −0.112 2.128 −0.346 1.427 MYGH04 −0.111 2.023 −0.158 0.943 IBRH16 −0.145 2.421 −0.209 1.386 MYGH05 −0.055 1.149 −0.204 −0.094 IBRH18 −0.103 2.211 −0.154 1.253 MYGH06 −0.022 0.592 −0.068 −0.846 IWTH04 −0.113 1.980 −0.201 0.724 MYGH09 −0.052 1.149 −0.181 −0.046 IWTH05 −0.134 2.212 −0.211 1.026 MYGH10 −0.044 1.614 −0.102 0.157 IWTH18 −0.115 2.168 −0.301 1.314 MYGH11 −0.100 2.002 −0.162 0.859 IWTH20 −0.030 0.831 −0.152 −0.453 TCGH07 −0.145 2.200 −0.257 0.951 IWTH21 −0.120 2.133 −0.114 0.860 TCGH12 −0.081 1.402 −0.132 0.089 IWTH23 −0.090 1.884 −0.201 0.815 TCGH14 −0.251 2.596 −0.636 1.947 IWTH24 −0.027 0.954 −0.075 −0.365 TKCH08 −0.077 1.927 −0.165 0.941 表 3 Vs30、D和T参数组合Z情况下待定系数值
Table 3. Regressive coefficients corresponding to Z in combination of Vs30, D and T
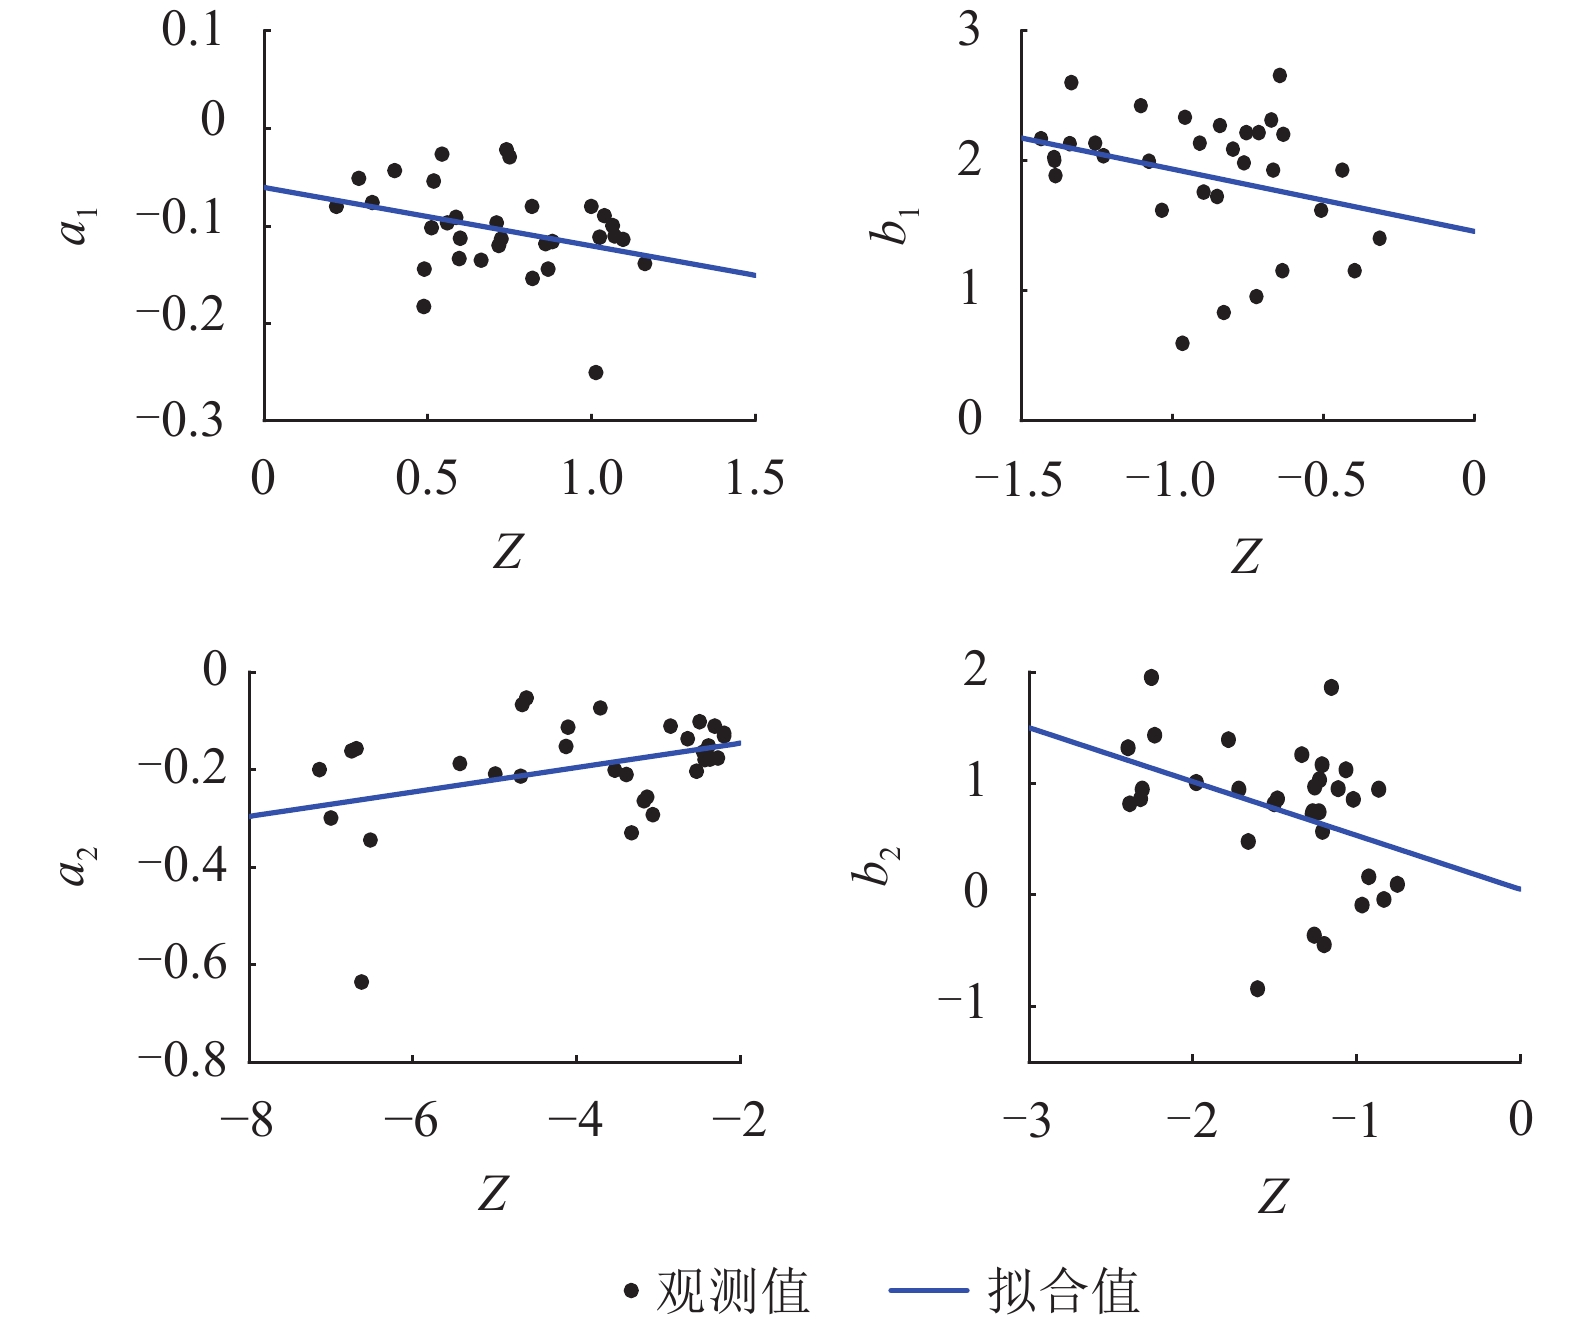
函数类型 待定系数 拟合系数 a1 b1 a2 b2 线性函数 C1 0.001 −0.002 −0.008 −0.003 C2 −0.044 0.045 0.051 0.044 C3 3.905 −3.946 −3.946 −3.935 C4 −0.061 1.456 −0.096 0.049 C5 −0.060 −0.479 0.025 −0.483 二次函数 C1 0.001 −0.003 −0.002 −0.003 C2 0.031 −0.062 −0.003 −0.046 C3 0.409 −3.445 −0.788 −3.235 C4 0.038 −0.589 −0.550 −2.427 C5 −0.265 −1.603 −0.707 −2.311 C6 0.109 −0.228 −0.325 −0.381 表 4 Vse、D和T参数组合Z情况下待定系数值
Table 4. Regressive coefficients corresponding to Z in combination of Vse, D and T
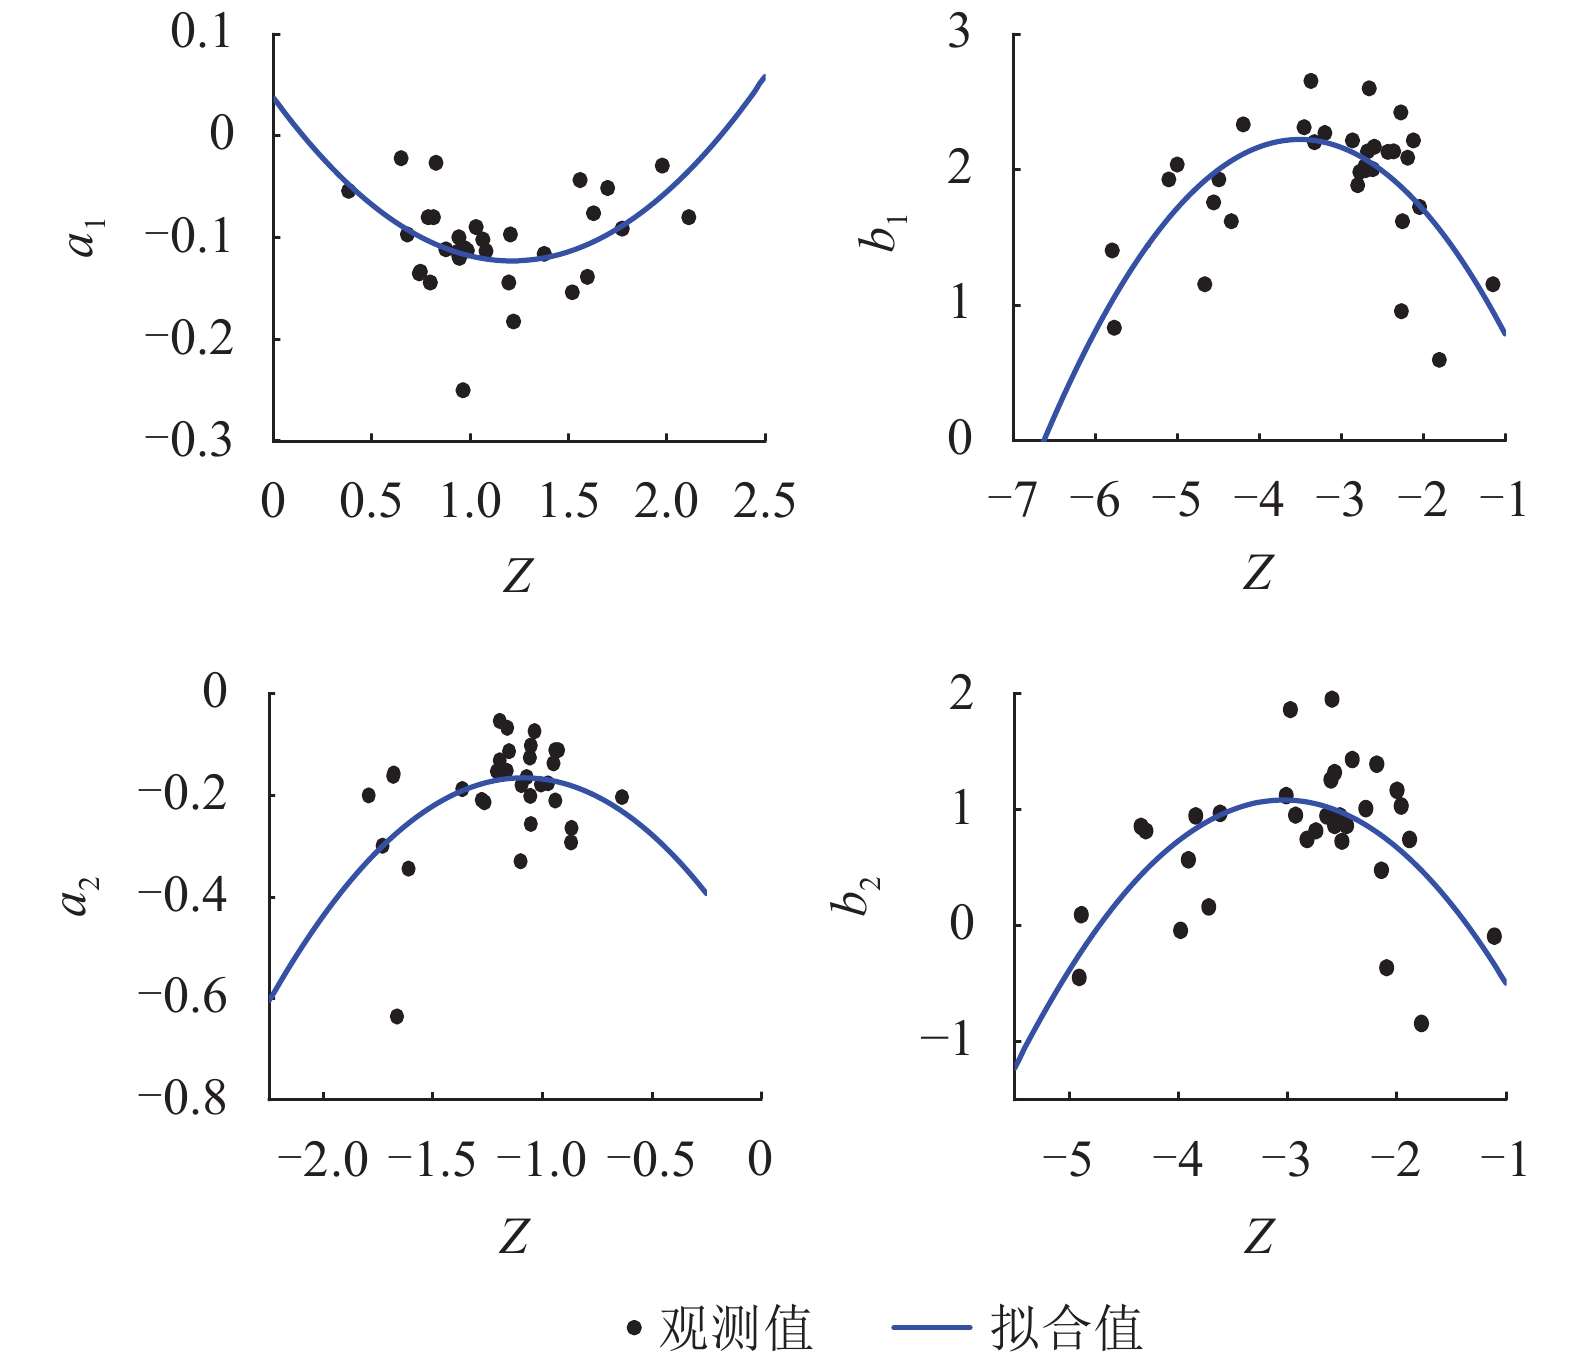
函数类型 待定系数 拟合系数 a1 b1 a2 b2 线性函数 C1 −0.002 −0.003 −0.001 −0.004 C2 0.057 0.060 −0.017 0.071 C3 −3.932 −3.884 −3.922 −3.899 C4 −0.059 1.377 −0.243 0.393 C5 0.081 −0.764 −0.032 −0.587 二次函数 C1 0.004 0.006 −0.001 0.006 C2 0.007 0.043 0.028 0.021 C3 1.020 2.734 −3.786 2.767 C4 0.094 0.651 −0.305 −0.614 C5 −0.347 0.990 −0.306 1.424 C6 0.134 −0.172 −0.143 −0.306 表 5 不同方法中拟合系数的残差平方和
Table 5. Sum of squared residuals of regressive coefficients in different methods
中间变量 函数类型 拟合系数残差平方和 a1 b1 a2 b2 Z(Vs30, D, T) 线性函数 0.060 7.042 0.312 10.459 二次函数 0.054 4.364 0.296 7.734 Z(Vse, D, T) 线性函数 0.060 6.857 0.334 10.937 二次函数 0.051 5.672 0.328 9.708 -
[1] 李晰,何澜,李倩,等. 脉冲型地震动对CFST拱桥抗震性能的影响分析[J]. 西南交通大学学报,2019,54(4): 731-740. doi: 10.3969/j.issn.0258-2724.20180855LI Xi, HE Lan, LI Qian, et al. Effect of pule-like ground motion on seismic performance of concrete-filled steel tubular arch bridge[J]. Journal of Southwest Jiaotong University, 2019, 54(4): 731-740. doi: 10.3969/j.issn.0258-2724.20180855 [2] 李小军. 地震动参数区划图场地条件影响调整[J]. 岩土工程学报,2013,35(S2): 21-29.LI Xiaojun. Adjustment of seismic ground motion parameters considering site effects in seismic zonation map[J]. Chinese Journal of Geotechnical Engineering, 2013, 35(S2): 21-29. [3] 中华人民共和国国家质量监督检验检疫总局, 中国国家标准化管理委员会. 中国地震动参数区划图: GB 18306—2015[S]. 北京: 中国标准出版社, 2016. [4] ANDREOTTI G, FAMÀ A, LAI C G. Hazard-dependent soil factors for site-specific elastic acceleration response spectra of Italian and European seismic building codes[J]. Bulletin of Earthquake Engineering, 2018, 16(12): 5769-5800. doi: 10.1007/s10518-018-0422-9 [5] 张红才,金星,李军,等. 地震预警系统研究及应用进展[J]. 地球物理学进展,2013,28(2): 706-719. doi: 10.6038/pg20130219ZHANG Hongcai, JIN Xing, LI Jun, et al. Progress of research and application of earthquake early warning system (EEWs)[J]. Progress in Geophysics, 2013, 28(2): 706-719. doi: 10.6038/pg20130219 [6] 俞言祥,汪素云. 青藏高原东北地区水平向基岩加速度峰值与反应谱衰减关系[J]. 地震学报,2004,26(6): 591-600. doi: 10.3321/j.issn:0253-3782.2004.06.004YU Yanxiang, WANG Suyun. Attenuation relations for horizontal peak ground acceleration and response spectrum in northeastern Tibetan Plateau region[J]. Acta Seismologica Sinica, 2004, 26(6): 591-600. doi: 10.3321/j.issn:0253-3782.2004.06.004 [7] BOORE D M, ATKINSON G M. Ground-motion prediction equations for the average horizontal com- ponent of PGA,PGV,and 5%-damped PSA at spectral periods between 0.01 s and 10.0 s[J]. Earthquake Spectra, 2008, 24(1): 99-138. doi: 10.1193/1.2830434 [8] DU K, DING B R, LUO H, et al. Relationship between peak ground acceleration,peak ground velocity,and macroseismic intensity in Western China[J]. Bulletin of the Seismological Society of America, 2019, 109(1): 284-297. doi: 10.1785/0120180216 [9] 陈龙伟,陈玉祥,袁晓铭. 基于强震数据的场地反应项分析及地震动参数预测[J]. 土木工程学报,2019,52(2): 97-105,117.CHEN Longwei, CHEN Yuxiang, YUAN Xiaoming. Site-term analysis and site-specific ground-motion parameters prediction based on strong motion data[J]. China Civil Engineering Journal, 2019, 52(2): 97-105,117. [10] FACCIOLI E, PAOLUCCI R, VANINI M. Evaluation of probabilistic site-specific seismic-hazard methods and associated uncertainties,with applications in the Po Plain,northern Italy[J]. Bulletin of the Seismological Society of America, 2015, 105(5): 2787-2807. doi: 10.1785/0120150051 [11] SHINGAKI Y, GOTO H, SAWADA S. Evaluation performance for site amplification factors:S-wave impedance vs. VS30[J]. Soils and Foundations, 2018, 58(4): 911-927. doi: 10.1016/j.sandf.2018.05.001 [12] TAVAKOLI H, SOLEIMANI KUTANAEI S. Evaluation of effect of soil characteristics on the seismic amplification factor using the neural network and reliability concept[J]. Arabian Journal of Geosciences, 2015, 8(6): 3881-3891. doi: 10.1007/s12517-014-1458-z [13] HASANCEBI N, ULUSAY R. Evaluation of site amplification and site period using different methods for an earthquake-prone settlement in Western Turkey[J]. Engineering Geology, 2006, 87(1/2): 85-104. [14] REGNIER J, BONILLA L F, BERTRAND E, et al. Influence of the VS profiles beyond 30 m depth on linear site effects:assessment from the KiK-net data[J]. Bulletin of the Seismological Society of America, 2014, 104(5): 2337-2348. doi: 10.1785/0120140018 [15] SANDıKKAYA M A, AKKAR S, BARD P Y. A probabilistic procedure to describe site amplification factors for seismic design codes[J]. Soil Dynamics and Earthquake Engineering, 2019, 126: 105068. doi: 10.1016/j.soildyn.2018.01.050 [16] 中国建筑科学研究院. 建筑抗震设计规范: GB 50011—2010[S]. 北京: 中国建筑工业出版社, 2010. [17] 李瑞山,袁晓铭. 成层场地基本周期简化计算方法研究[J]. 岩土力学,2019,40(8): 3227-3235.LI Ruishan, YUAN Xiaoming. Simplified calculation method for the fundamental period of layered soil sites[J]. Rock and Soil Mechanics, 2019, 40(8): 3227-3235. [18] WANG Suyang, SHI Yang, JIANG Weiping, et al. Estimating site fundamental period from shear-wave velocity profile[J]. Bulletin of the Seismological Society of America, 2018, 108(6): 3431-3445. doi: 10.1785/0120180103 [19] 金井清. 工程地震学[M]. 常宝琦, 张虎男, 译. 北京: 地震出版社, 1987. [20] 唐川,陈龙伟. 场地校正的地表PGA放大系数概率模型研究[J]. 工程力学,2020,37(12): 99-113. doi: 10.6052/j.issn.1000-4750.2020.01.0023TANG Chuan, CHEN Longwei. Probability modelling of PGA amplification factors corrected by site condi- tions[J]. Engineering Mechanics, 2020, 37(12): 99-113. doi: 10.6052/j.issn.1000-4750.2020.01.0023 [21] BAZZURRO P. Nonlinear soil-site effects in probabilistic seismic-hazard analysis[J]. Bulletin of the Seismological Society of America, 2004, 94(6): 2110-2123. doi: 10.1785/0120030216 -


 下载:
下载:
