

Time Covariate Modeling of Overtaking Risk Evolution on Two-Lane Highways
-
摘要:
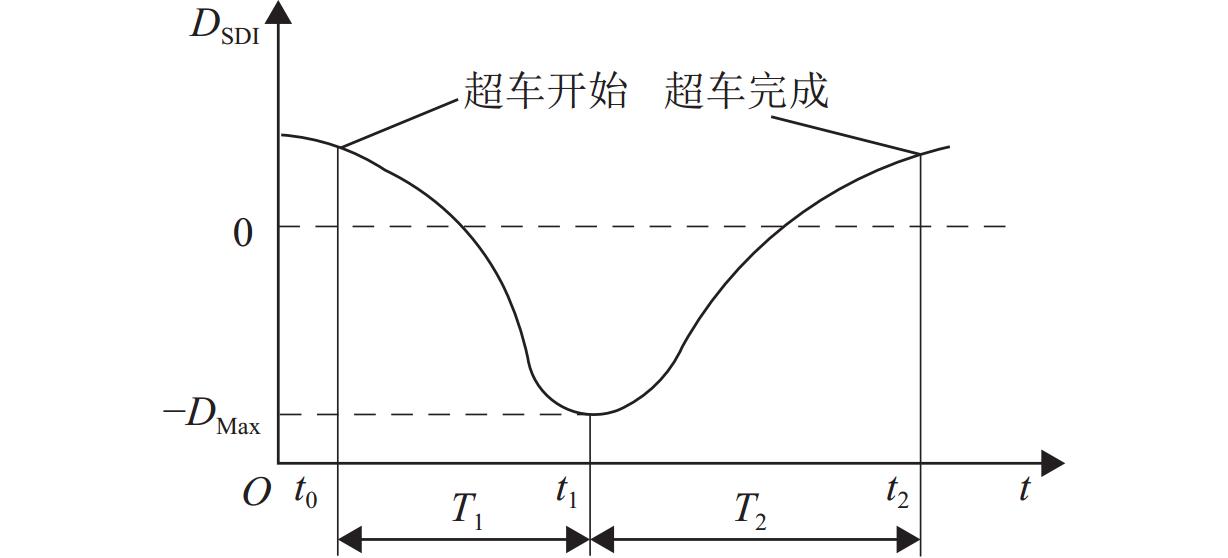
为获取双车道公路超车行为风险演化的时间特征,在利用超车风险视距指标分析超车风险演化特征的基础上,提出基于改进形状参数协变量建模方法的全参数AFT (accelerated failure time)模型预测路段期望超车时间,并通过无人机采集典型超车路段场景的328组完整超车轨迹数据进行实例分析和对比验证. 结果表明:超车风险演化时间包括风险递增(
T 1)和风险递减(T 2)两阶段,平均超车距离分别为141.10、99.41 m,平均持续时间分别为8.18、5.61 s,超速超车现象严重;对向来车对T 1阶段有延长作用,超越货车对T 1阶段有缩短作用,场景异质性影响特征明显;全参数AFT模型在数据拟合度和异质性捕获能力方面更具优势,超车速度均值、超车距离和相对横向偏移标准差为模型关键协变量;预测得到在1%的生存率下3个研究场景的期望超车时间范围分别为18~93、18~50 s和18~39 s. 本文扩展了双车道公路超车持续时间建模方法,对于已建成路段超车安全管控和规划路段道路设计具有重要价值.Abstract:In order to obtain the temporal characteristics of overtaking risk evolution on two-lane highways, a full-parameter accelerated failure time (AFT) model based on an improved shape parameter covariate modeling method was proposed to predict the expected overtaking time of the road section, which was carried out after introducing the overtaking risk sight distance index to analyze the evolution characteristics of overtaking risk. A total of 328 sets of complete overtaking trajectory data collected by UAVs in typical overtaking road sections were analyzed and compared. The results show that the overtaking risk evolution consists of two stages: a risk-increasing stage (
T 1) and a risk-decreasing stage (T 2). The average overtaking distances forT 1 andT 2 are 141.10 and 99.41 m, respectively, and the average durations are 8.18 and 5.61 s, respectively, indicating a significant occurrence of speeding during overtaking. Oncoming vehicles can prolongT 1, while overtaking of trucks can shortenT 1, indicating a strong effect of scene heterogeneity. The full-parameter AFT model demonstrates better performance in terms of data fitting and heterogeneity capturing. The mean overtaking speed, overtaking distance, and standard deviation of relative lateral deviation were identified as key covariates of the model. Under a survival rate of 1%, the expected overtaking time ranges for the three studied scenarios are 18–93, 18–50 s, and 18–39 s, respectively. The research advances the overtaking duration modeling method for two-lane highways and provides valuable insights for the management of overtaking on existing road sections and the design of road sections under construction. -
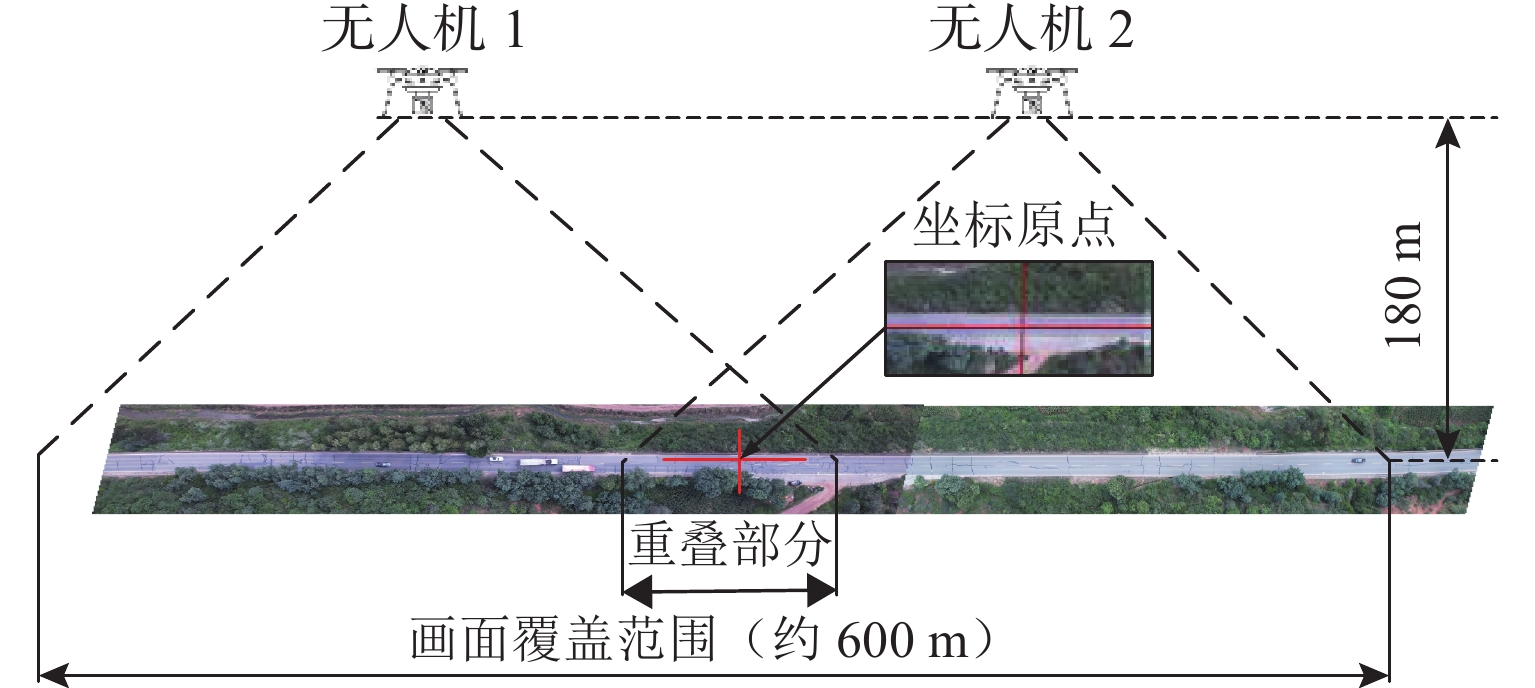
图 2 无人机同步交通流视频数据采集示意
Figure 2. Schematic diagram of UAV-synchronized traffic flow video data collection
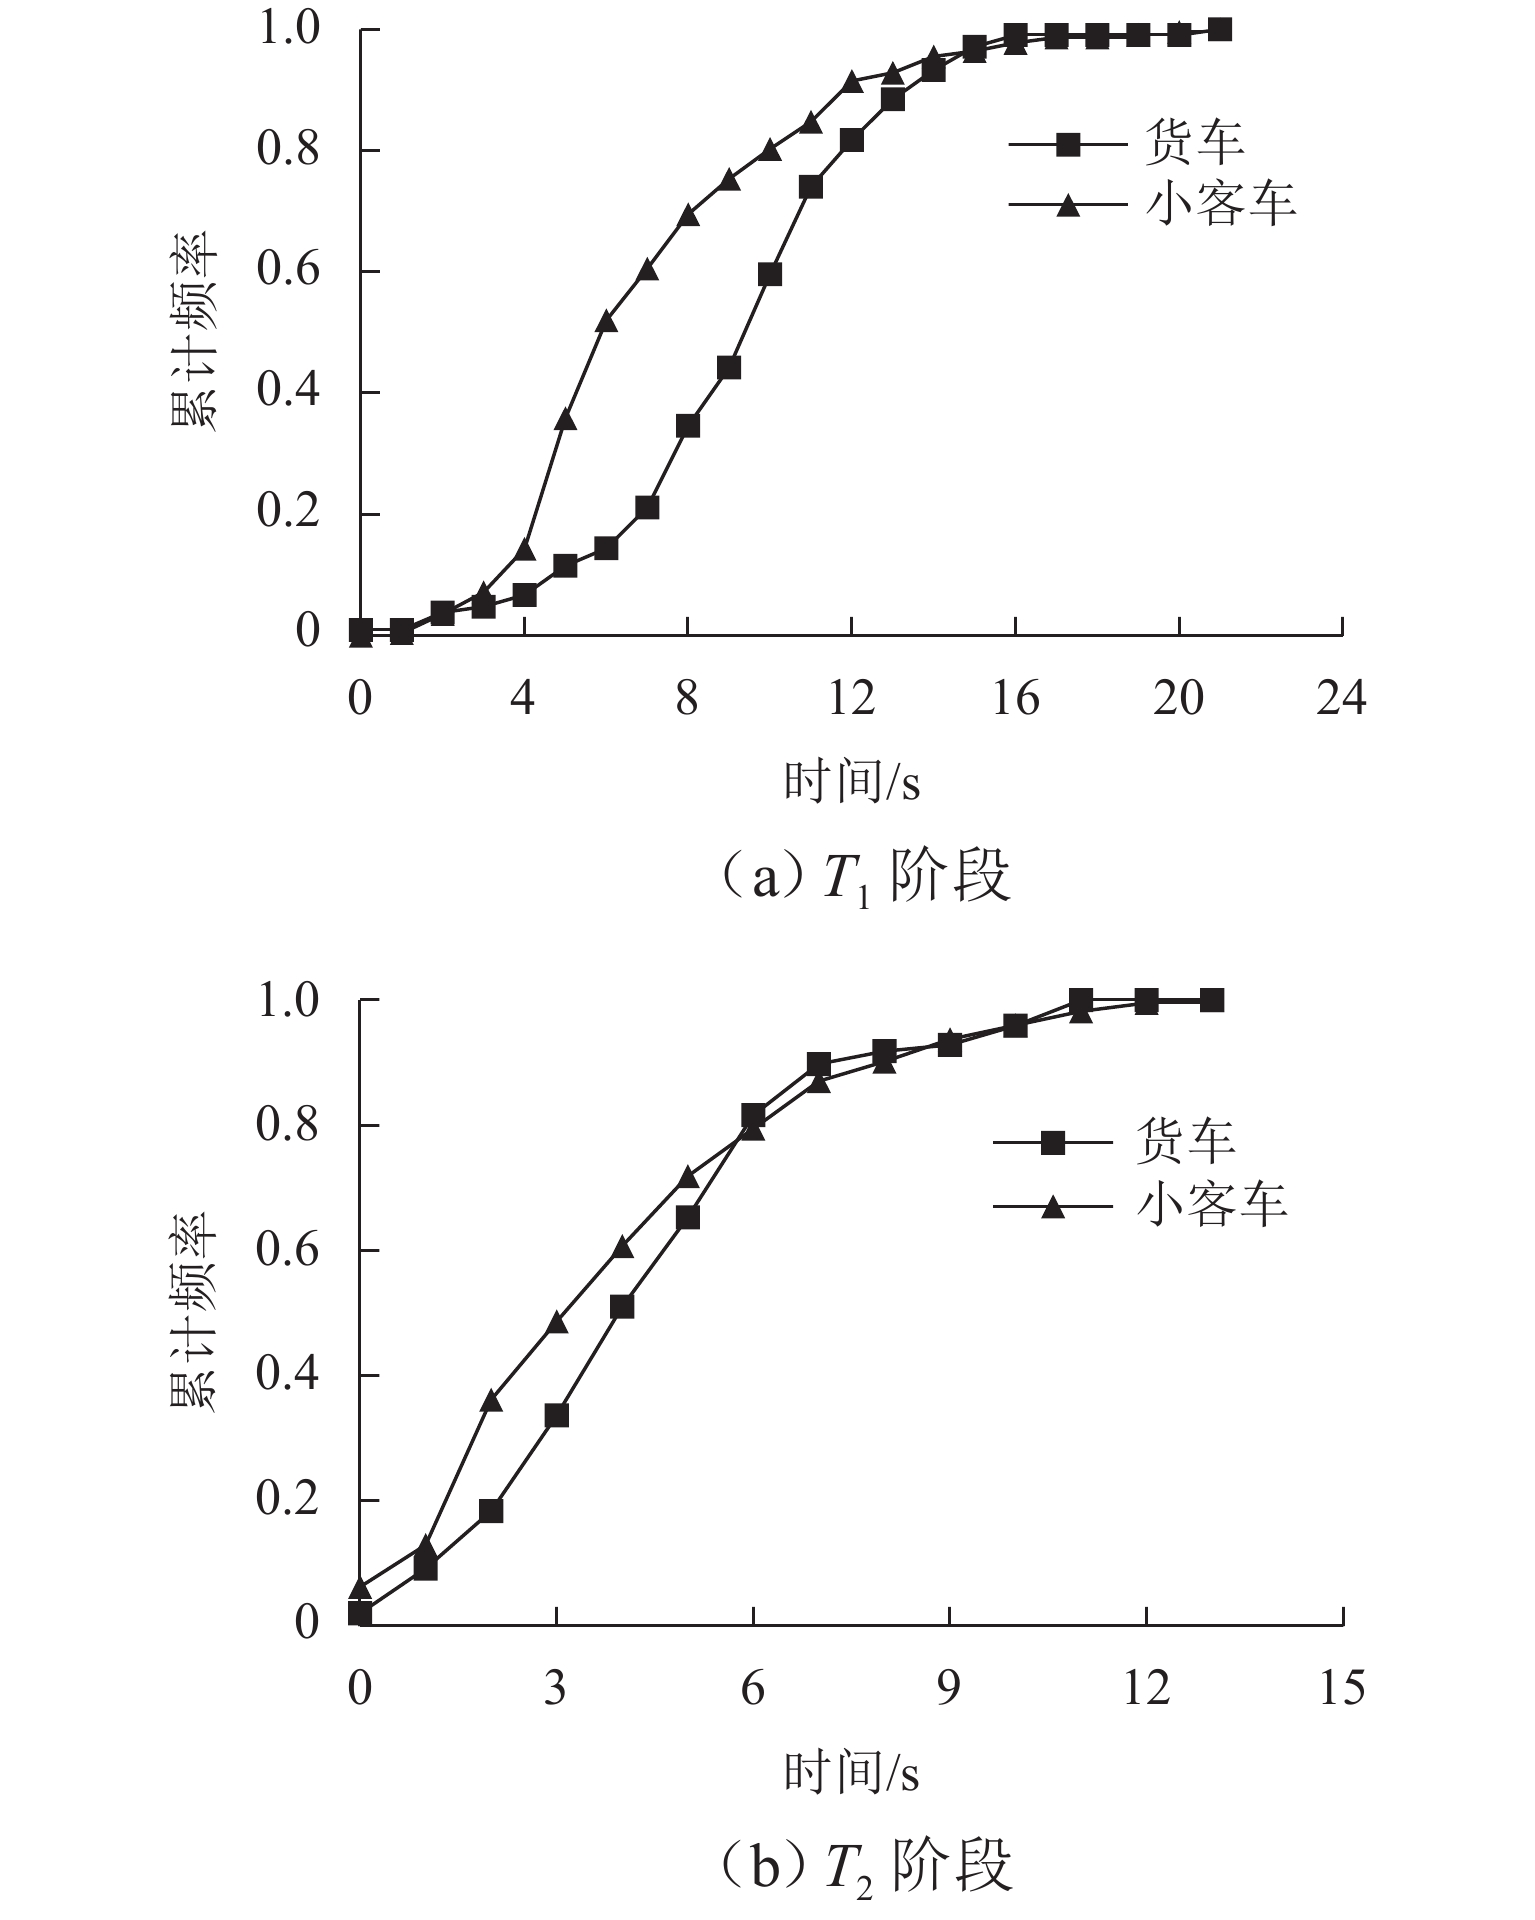
图 6 不同超越对象风险持续时间累计频率特征
Figure 6. Cumulative frequency characteristics of risk duration with different overtaken vehicles
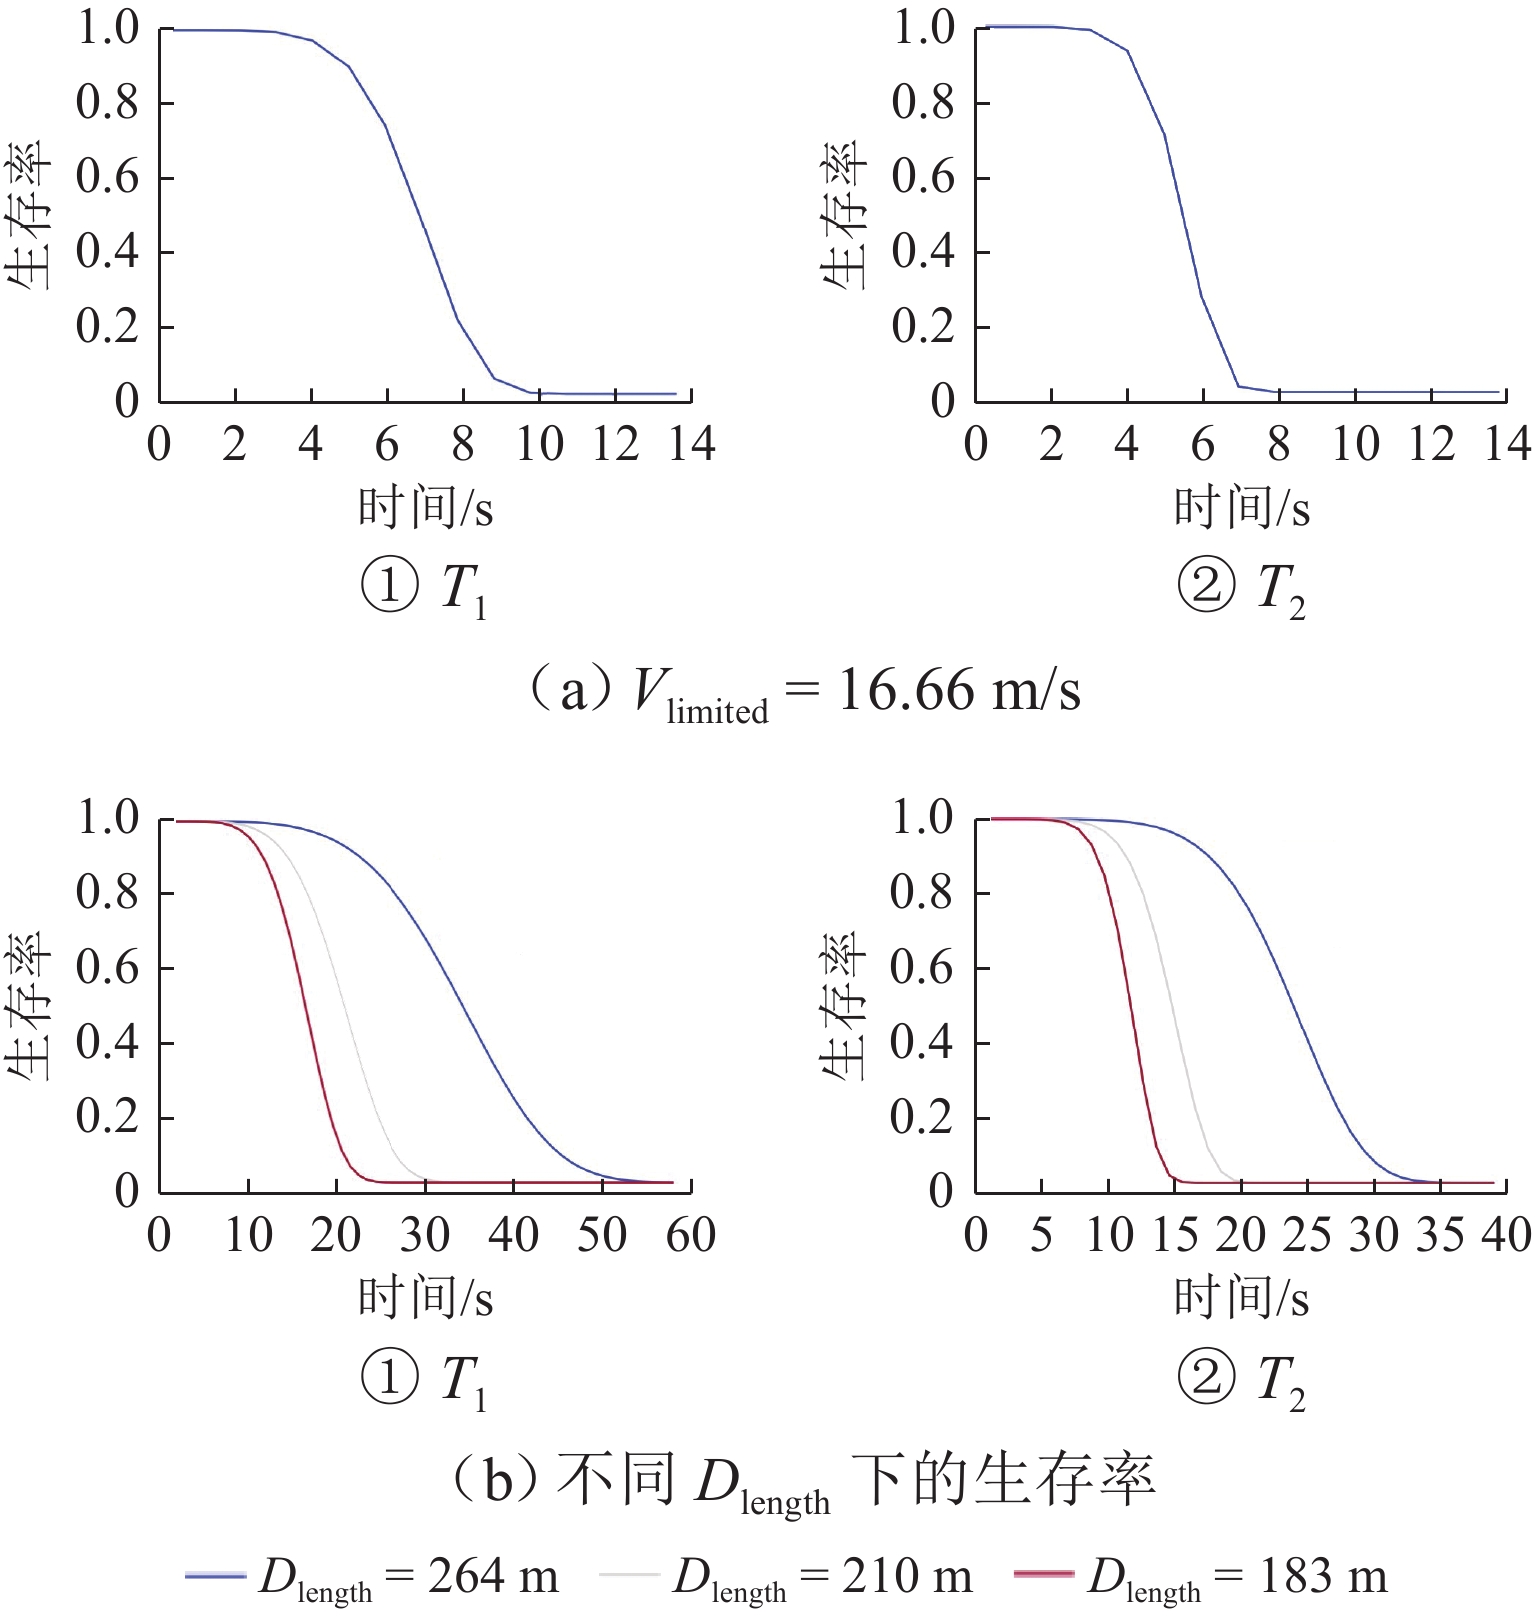
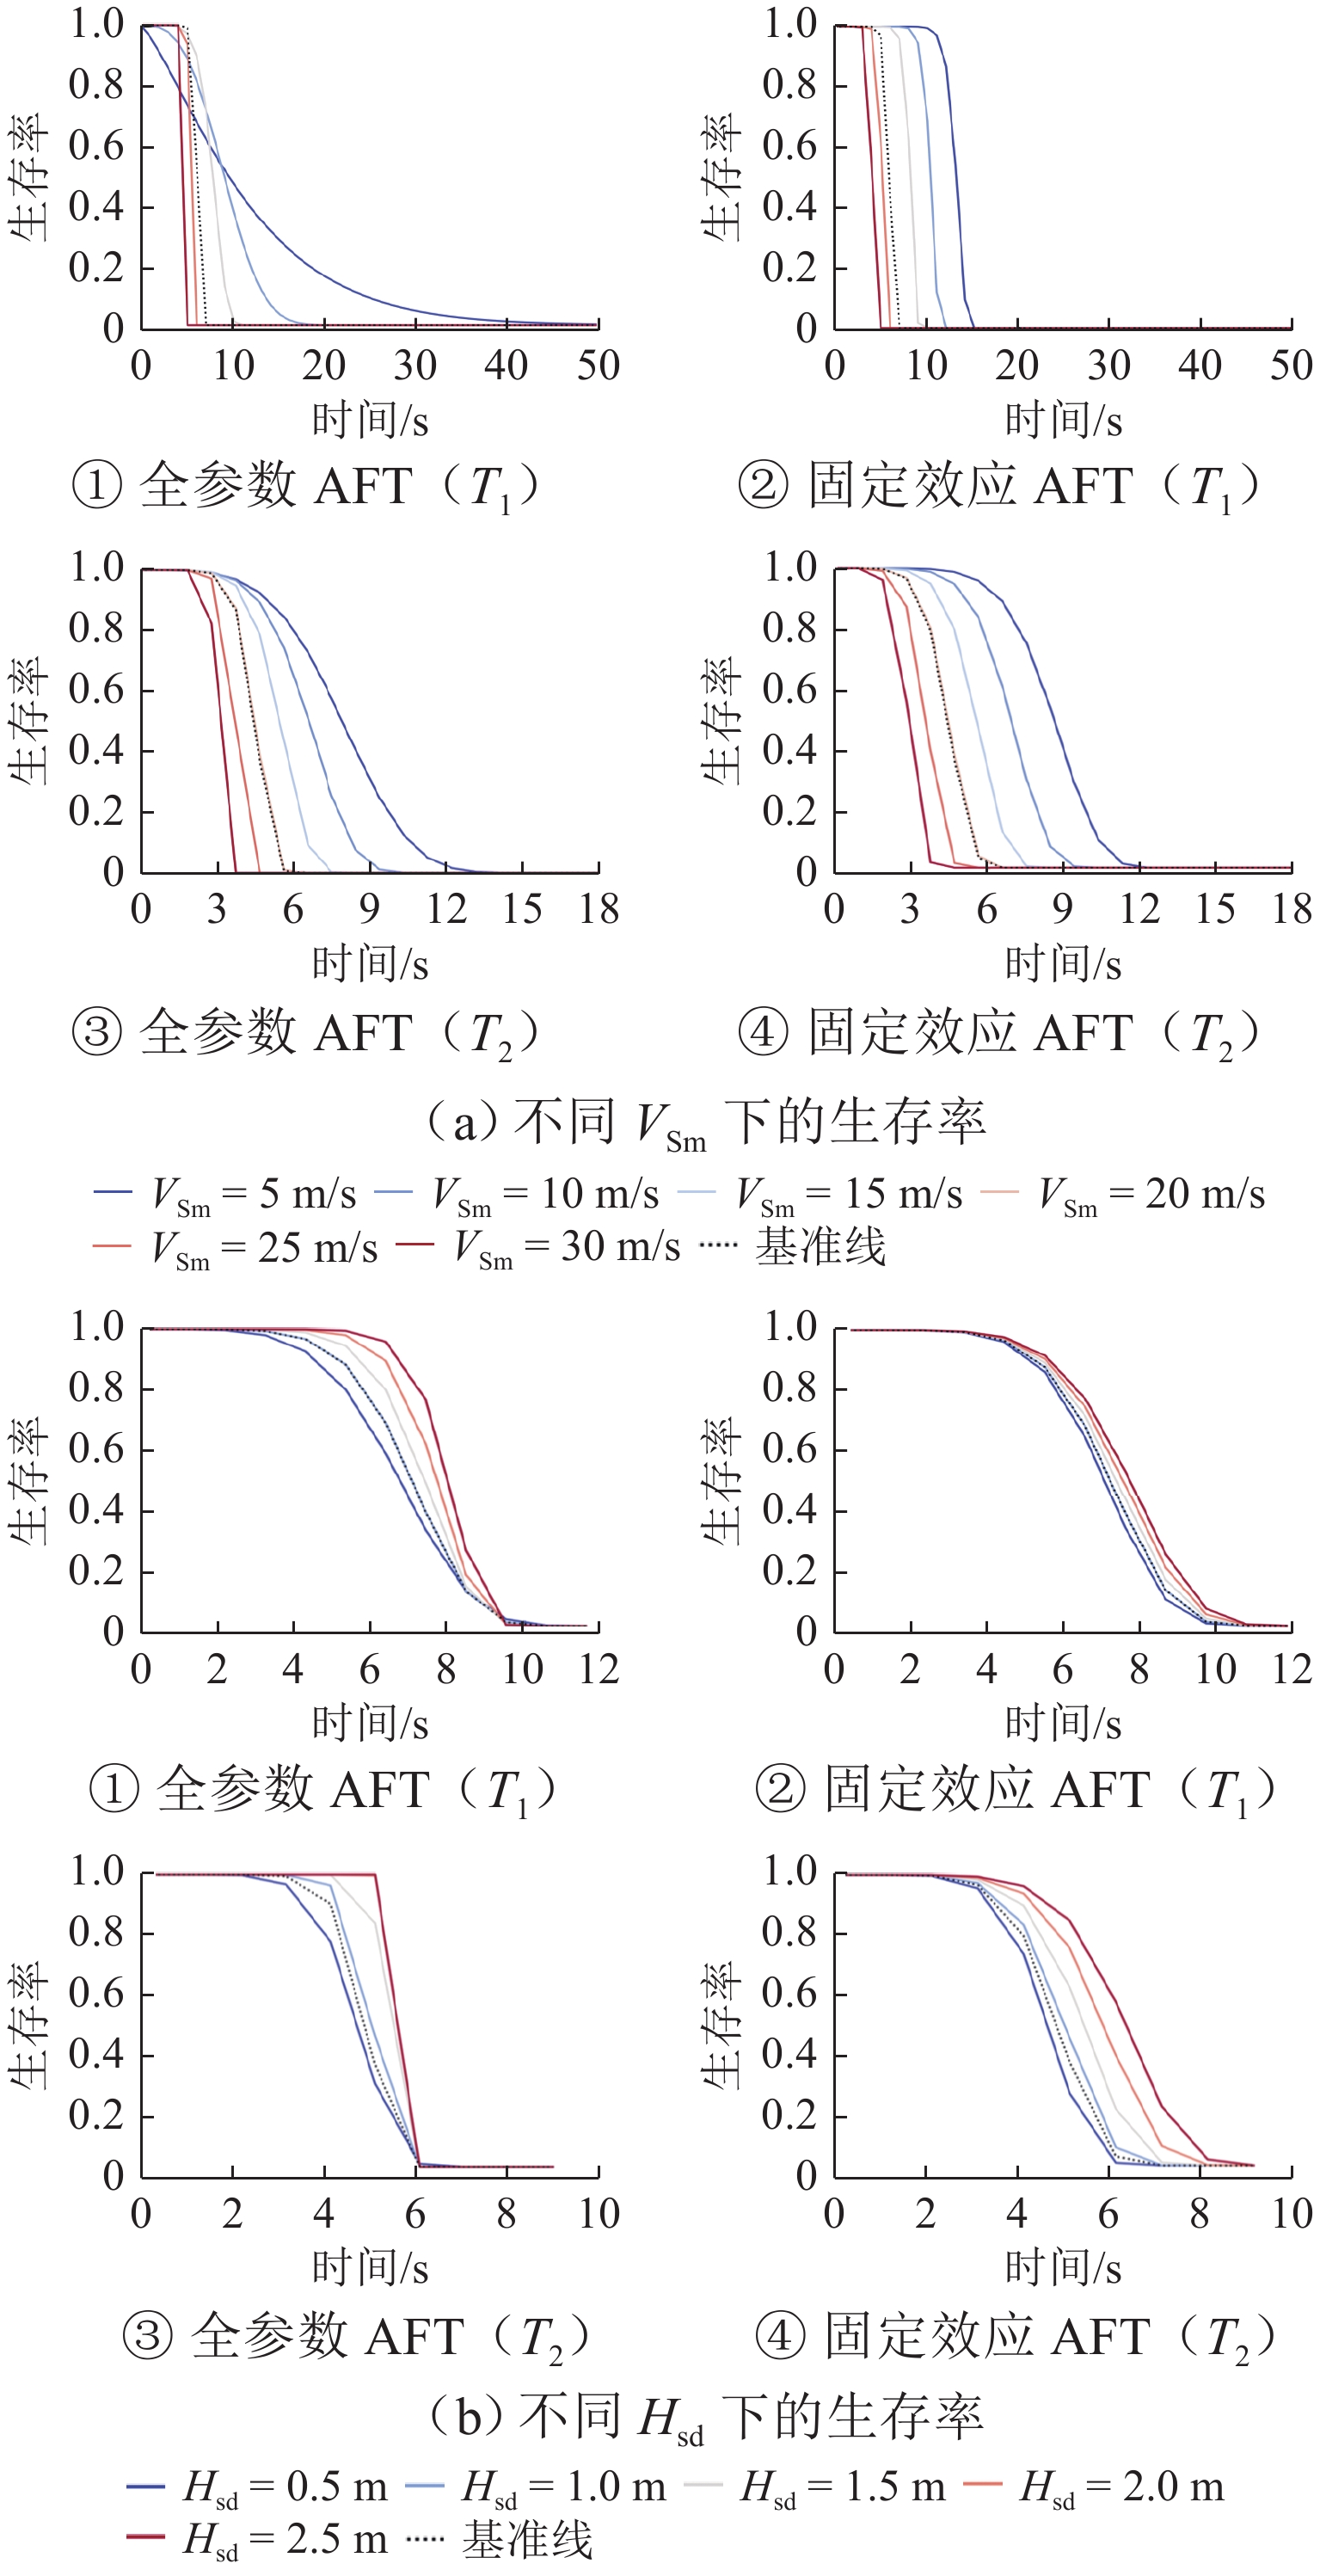
图 10 路段期望超车时间生存函数曲线预测
Figure 10. Predicted survival curves of expected overtaking time for road sections
表 1 特征变量
Table 1. Characteristic variables
变量类型 符号 说明 行为特征 VSm/(m•s−1) 主车速度均值 VFm/(m•s−1) 被超越车速度均值 ASm/(m•s−2) 主车加速度均值 AFm/(m•s−2) 被超越车加速度均值 VSsd/(m•s−1) 主车速度标准差 VFsd/(m•s−1) 被超越车速度标准差 ASsd/(m•s−2) 主车加速度标准差 AFsd/(m•s−2) 被超越车加速度标准差 相对特征 Vm/(m•s−1) 速度差均值 Hm/m 相对偏移均值 Tm/s 车头时距均值 Wm/m 车头间距均值 Vsd/(m•s−1) 速度差标准差 Hsd/m 相对偏移标准差 Tsd/s 车头时距标准差 Wsd/m 车头间距标准差 其他特征 Ttime/s 超车总时间 Ddistance/m 超车总距离 I 是否有对向来车(0:无,1:有) OF 被超越车类型(0:乘用车,1:货车)  下载: 导出CSV
表 2 特征变量描述性统计
Table 2. Descriptive statistics of characteristic variables
阶段 类型 Ttime Ddistance VSm ASm VFm AFm VSsd ASsd VFsd AFsd T1 均值 8.18 s 141.10 m 17.33 m/s 0.40 m/s2 14.85 m/s 0.08 m/s2 1.78 m/s 0.60 m/s2 0.73 m/s 0.41 m/s2 方差 3.62 s2 51.24 m2 5.82 m2/s2 0.54 m2/s4 4.98 m2/s2 0.41 m2/s4 3.46 m2/s2 0.50 m2/s4 1.07 m2/s2 0.29 m2/s4 最大值 21.84 s 306.18 m 31.60 m/s 1.98 m/s2 26.68 m/s 3.49 m/s2 59.51 m/s 4.92 m/s2 11.13 m/s 2.50 m/s2 最小值 1.83 s 31.26 m 4.48 m/s −2.41 m/s2 2.28 m/s −1.54 m/s2 0.03 m/s 0.18 m/s2 0.03 m/s 0.07 m/s2 T2 均值 5.61 s 99.41 m 19.95 m/s 0.24 m/s2 13.90 m/s 0.04 m/s2 0.97 m/s 0.58 m/s2 0.44 m/s 0.40 m/s2 方差 2.91 s2 47.70 m2 7.10 m2/s2 0.74 m2/s4 4.93 m2/s2 0.39 m2/s4 2.12 m2/s2 0.59 m2/s4 0.62 m2/s2 0.41 m2/s4 最大值 21.30 s 387.69 m 94.95 m/s 3.10 m/s2 47.77 m/s 2.52 m/s2 32.94 m/s 4.94 m/s2 8.11 m/s 3.50 m/s2 最小值 1.00 s 12.19 m 4.02 m/s −2.41 m/s2 3.11 m/s −0.92 m/s2 0.02 m/s 0 0.03 m/s 0 阶段 类型 Vm Hm Wm Tm Vsd Hsd Wsd Tsd I OF T1 均值 3.48 m/s 1.90 m 5.89 m 8.93 s 1.77 m/s 1.01 m 3.85 m 5.45 s 0.23 0.32 方差 2.83 m2/s2 1.50 m2 14.33 m2 9.70 s2 3.47 m2/s2 0.36 m2 7.45 m2 5.03 s2 0.42 0.47 最大值 26.78 m/s 4.26 m 113.96 m 45.10 s 59.51 m/s 2.01 m 79.28 m 25.62 s 1.00 1.00 最小值 −4.74 m/s −3.48 m −30.47 m −33.67 s 0.03 m/s 0.03 m 0.09 m 0.19 s 0 0 T2 均值 9.69 m/s 2.28 m −3.64 m −8.93 s 0.99 m/s 0.77 m 3.80 m 6.18 s 0.22 0.31 方差 7.02 m2/s2 1.67 m2 9.45 m2 10.92 s2 2.11 m2/s2 0.40 m2 6.42 m2 5.36 s2 0.41 0.46 最大值 94.95 m/s 5.88 m 27.52 m 16.28 s 32.94 m/s 2.34 m 58.51 m 24.49 s 1.00 1.00 最小值 −2.73 m/s −3.97 m −67.89 m −37.47 s 0.02 m/s 0.01 m 0.05 m 0.09 s 0 0
下载: 导出CSV
表 3 固定效应AFT参数估计(对$\lambda $建模)
Table 3. Parameter estimation of fixed effect AFT (for $\lambda $ modeling)
演化阶段 协变量 β exp(β) SE Z P CI95(β) 下限 上限 T1 VSm −0.047 0.954 0.002 −27.550 < 0.0005 −0.051 −0.044 Hsd 0.045 1.046 0.030 1.509 0.1310 −0.014 0.104 Ddistance 0.007 1.007 0 24.858 < 0.0005 0.006 0.007 Iβ 1.852 6.370 0.047 39.027 < 0.0005 1.759 1.945 对数似然值 331.422 AIC 1111.154 T2 VSm −0.043 0.958 0.001 −41.027 < 0.0005 −0.045 −0.041 Hsd 0.158 1.171 0.029 5.459 < 0.0005 0.101 0.215 Ddistance 0.009 1.010 0 35.353 < 0.0005 0.009 0.010 Iβ 1.453 4.277 0.026 55.405 < 0.0005 1.402 1.505 对数似然值 483.496 AIC 820.904 注:T1阶段,$ \lambda ({\boldsymbol{x}})\text{=}\mathrm{exp}(1.852-0.047x_1 + 0.045x_2 + 0.007x_3),\rho \text{=1}\text{.773} $;T2阶段,$ \lambda ({\boldsymbol{x}})\text{=}\mathrm{exp}(1.453-0.043x_1 + 0.158x_2 + $$0.009x_3), \rho \text{=1}\text{.892} $.
下载: 导出CSV
表 4 全参数AFT参数估计(对$\lambda $和$\rho $建模)
Table 4. Parameter estimation of full-parameter AFT (for$\lambda $ and $\rho $ modeling)
演化阶段 协变量 β exp(β) SE Z P CI95(β) 下限 上限 T1 VSm −0.046 0.955 0.002 −24.95 < 0.0005 −0.05 −0.043 Hsd 0.067 1.069 0.030 2.249 0.0250 0.009 0.125 Ddistance 0.006 1.006 0 21.822 < 0.0005 0.006 0.007 Iβ 1.843 6.312 0.058 31.954 < 0.0005 1.730 1.956 对数似然值 336.534 AIC 1095.151 T2 VSm −0.036 0.964 0.001 −58.397 < 0.0005 −0.038 −0.035 Hsd 0.097 1.102 0.015 6.367 < 0.0005 0.067 0.127 Ddistance 0.009 1.009 0 53.504 < 0.0005 0.008 0.009 Iβ 1.457 4.294 0.016 91.723 < 0.0005 1.426 1.488 对数似然值 657.200 AIC 568.960 注:T1阶段,$ \lambda ({\boldsymbol{x}}){\text{ = }}\exp (1.843 - 0.046x_1 + 0.067x_2 + 0.006x_3) $,$\rho ({\boldsymbol{x}}){\text{ = }}\exp (1.011 + 0.013x_1 + 0.462x_2 + 0.001x_3) $;T2阶段,$ \lambda ({\boldsymbol{x}}){\text{ = }}\exp (1.457 - 0.036x_1 + 0.097x_2 + 0.009x_3) $,$ \rho ({\boldsymbol{x}}){\text{ = }}\exp ( - 0.160 + 0.062x_1 + 1.324x_2 + 0.002x_3) $.
下载: 导出CSV
表 5 不同生存率下路段期望超车时间
Table 5. Expected overtaking time under different survival rates
生存率 路段 下限/s 上限/s 0.01 路段 1 17.969 93.303 路段 2 50.365 路段 3 39.314 0.05 路段 1 15.820 77.825 路段 2 41.902 路段 3 30.588 0.15 路段 1 14.859 70.610 路段 2 38.256 路段 3 27.873
下载: 导出CSV
-
[1] 徐进, 杨奎, 鲁工圆, 等. 基于自然驾驶的山区公路行驶舒适性研究[J]. 西南交通大学学报, 2017, 52(2): 309-318. doi: 10.3969/j.issn.0258-2724.2017.02.014XU Jin, YANG Kui, LU Gongyuan, et al. Investigation on driving comfort of passenger cars on mountain roads based on naturalistic driving[J]. Journal of Southwest Jiaotong University, 2017, 52(2): 309-318. doi: 10.3969/j.issn.0258-2724.2017.02.014 [2] WU Q, CHEN F, ZHANG G H, et al. Mixed logit model-based driver injury severity investigations in single- and multi-vehicle crashes on rural two-lane highways[J]. Accident Analysis & Prevention, 2014, 72: 105-115. [3] PAN J, SHEN Y J. Assessing driving risk at the second phase of overtaking on two-lane highways for young novice drivers based on driving simulation[J]. International Journal of Environmental Research and Public Health, 2022, 19(5): 2691.1-2691.13. [4] 徐婷, 邓恺龙, 刘永涛, 等. 基于航测数据的不同风格换道轨迹规划[J]. 西南交通大学学报, 2024, 59(3): 720-728. doi: 10.3969/j.issn.0258-2724.20230392XU Ting, DENG Kailong, LIU Yongtao, et al. Different style lane change trajectory planning based on aerial survey data[J]. Journal of Southwest Jiaotong University, 2024, 59(3): 720-728. doi: 10.3969/j.issn.0258-2724.20230392 [5] 吴德华, 彭锐, 陈荣峰. 异质流网联车的不同换道集聚策略[J]. 西南交通大学学报, 2023, 58(2): 348-356.WU Dehua, PENG Rui, CHEN Rongfeng. Different lane change agglomeration strategies of connected vehicles in heterogeneous flow networks[J]. Journal of Southwest Jiaotong University, 2023, 58(2): 348-356. [6] 赵建东, 赵志敏, 屈云超, 等. 轨迹数据驱动的车辆换道意图识别研究[J]. 交通运输系统工程与信息, 2022, 22(4): 63-71.ZHAO Jiandong, ZHAO Zhimin, QU Yunchao, et al. Vehicle lane change intention recognition driven by trajectory data[J]. Journal of Transportation Systems Engineering and Information Technology, 2022, 22(4): 63-71. [7] SHANGGUAN Q Q, FU T, WANG J H, et al. A proactive lane-changing risk prediction framework considering driving intention recognition and different lane-changing patterns[J]. Accident Analysis & Prevention, 2022, 164: 106500.1-106500.14. [8] CHEN Q H, HUANG H L, LI Y, et al. Modeling accident risks in different lane-changing behavioral patterns[J]. Analytic Methods in Accident Research, 2021, 30: 100159.1-100159.20. [9] LI Y, GU R F, LEE J, et al. The dynamic tradeoff between safety and efficiency in discretionary lane-changing behavior: a random parameters logit approach with heterogeneity in means and variances[J]. Accident Analysis & Prevention, 2021, 153: 106036.1-106036.7. [10] YANG M M, WANG X S, QUDDUS M. Examining lane change gap acceptance, duration and impact using naturalistic driving data[J]. Transportation Research Part C: Emerging Technologies, 2019, 104: 317-331. doi: 10.1016/j.trc.2019.05.024 [11] ALI Y, HAQUE M M, ZHENG Zuduo, et al. A hazard-based duration model to quantify the impact of connected driving environment on safety during mandatory lane-changing[J]. Transportation Research Part C: Emerging Technologies, 2019, 106: 113-131. doi: 10.1016/j.trc.2019.07.015 [12] 戢晓峰, 戴秉佑, 普永明, 等. 基于生存分析的山区双车道公路超车持续时间模型[J]. 交通运输系统工程与信息, 2022, 22(6): 183-190.JI Xiaofeng, DAI Bingyou, PU Yongming, et al. Overtaking duration model of two-lane mountainous highways based on survival analysis[J]. Journal of Transportation Systems Engineering and Information Technology, 2022, 22(6): 183-190. [13] PARK H, OH C, MOON J, et al. Development of a lane change risk index using vehicle trajectory data[J]. Accident Analysis & Prevention, 2018, 110: 1-8. [14] WILSON T, BEST W. Driving strategies in overtaking[J]. Accident Analysis & Prevention, 1982, 14(3): 179-185. [15] 刘启远, 孙剑, 田野, 等. 机非交互路段非机动车越线超车行为建模与仿真[J]. 同济大学学报(自然科学版), 2019, 47(11): 1585-1592, 1599.LIU Qiyuan, SUN Jian, TIAN Ye, et al. Modeling and simulation of cross-line overtaking behavior of non-motorized vehicles at mixed flow road section[J]. Journal of Tongji University (Natural Science), 2019, 47(11): 1585-1592, 1599. [16] 戢晓峰, 徐迎豪, 普永明, 等. 山区双车道公路货车移动遮断小客车跟驰风险预测模型[J]. 吉林大学学报 (工学版), 2024, 54(5): 1323-1331.JI Xiaofeng, XU Yinghao, PU Yongming, et al. Risk prediction model of passenger car following behavior under truck movement interruption of two-lane highway in mountainous area[J], Journal of Jilin University (Engineering and Technology Edition), 2024, 54(5): 1323-1331. [17] MANNERING F, BHAT C R, SHANKAR V, et al. Big data, traditional data and the tradeoffs between prediction and causality in highway-safety analysis[J]. Analytic Methods in Accident Research, 2020, 25: 100113.1-100113.9. -

 下载:
下载:

 点击查看大图
计量
- 文章访问数: 259
- HTML全文浏览量: 150
- PDF下载量: 48
- 被引次数: 0