Theoretical and Test Study of Impact Force and Impact Depth of Falling Rocks on Buffering Soil Layers
-
摘要:
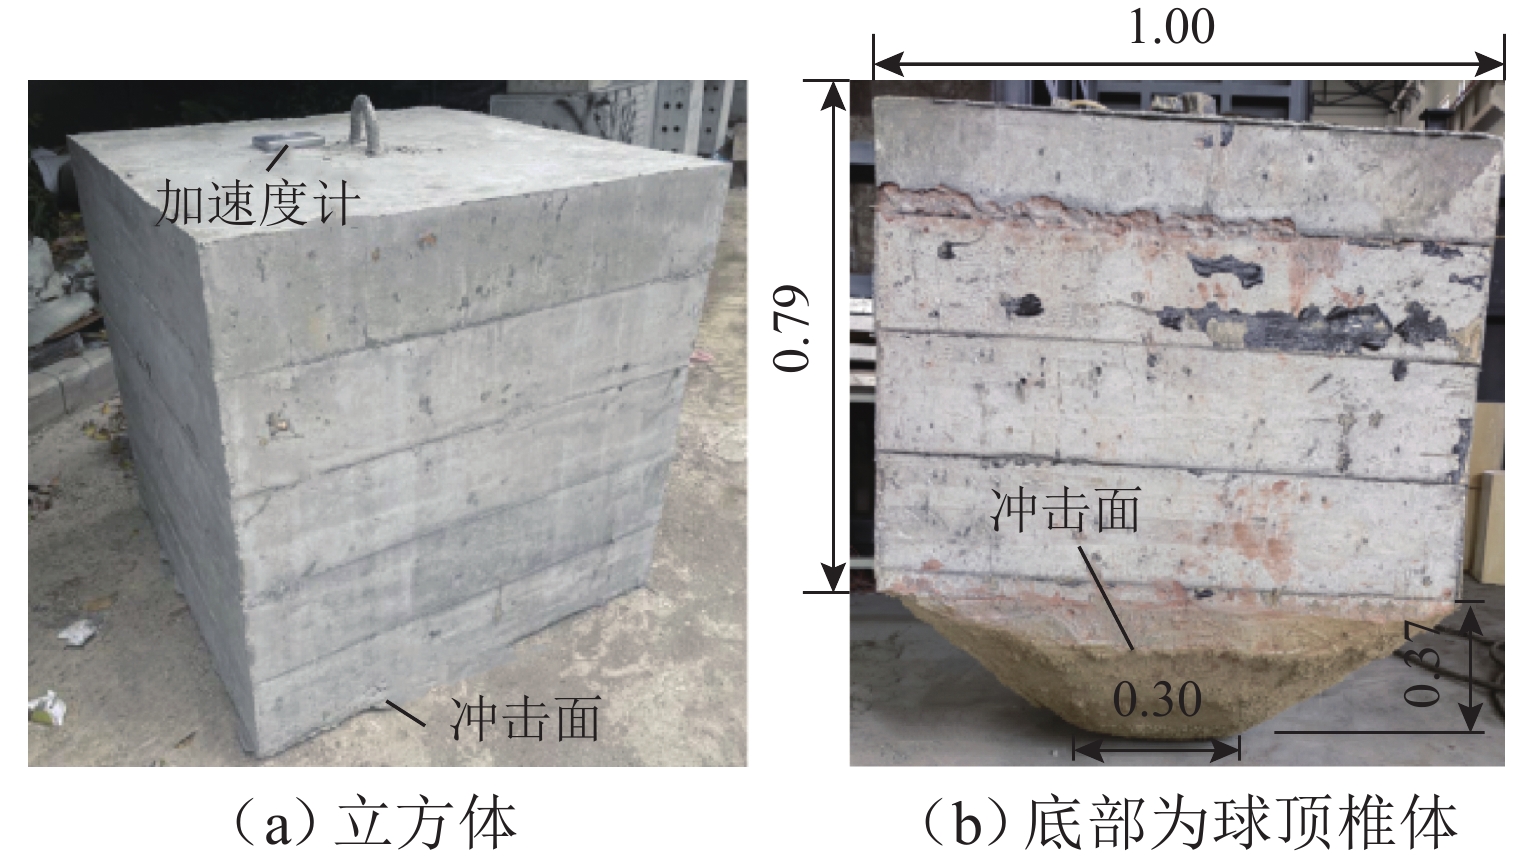
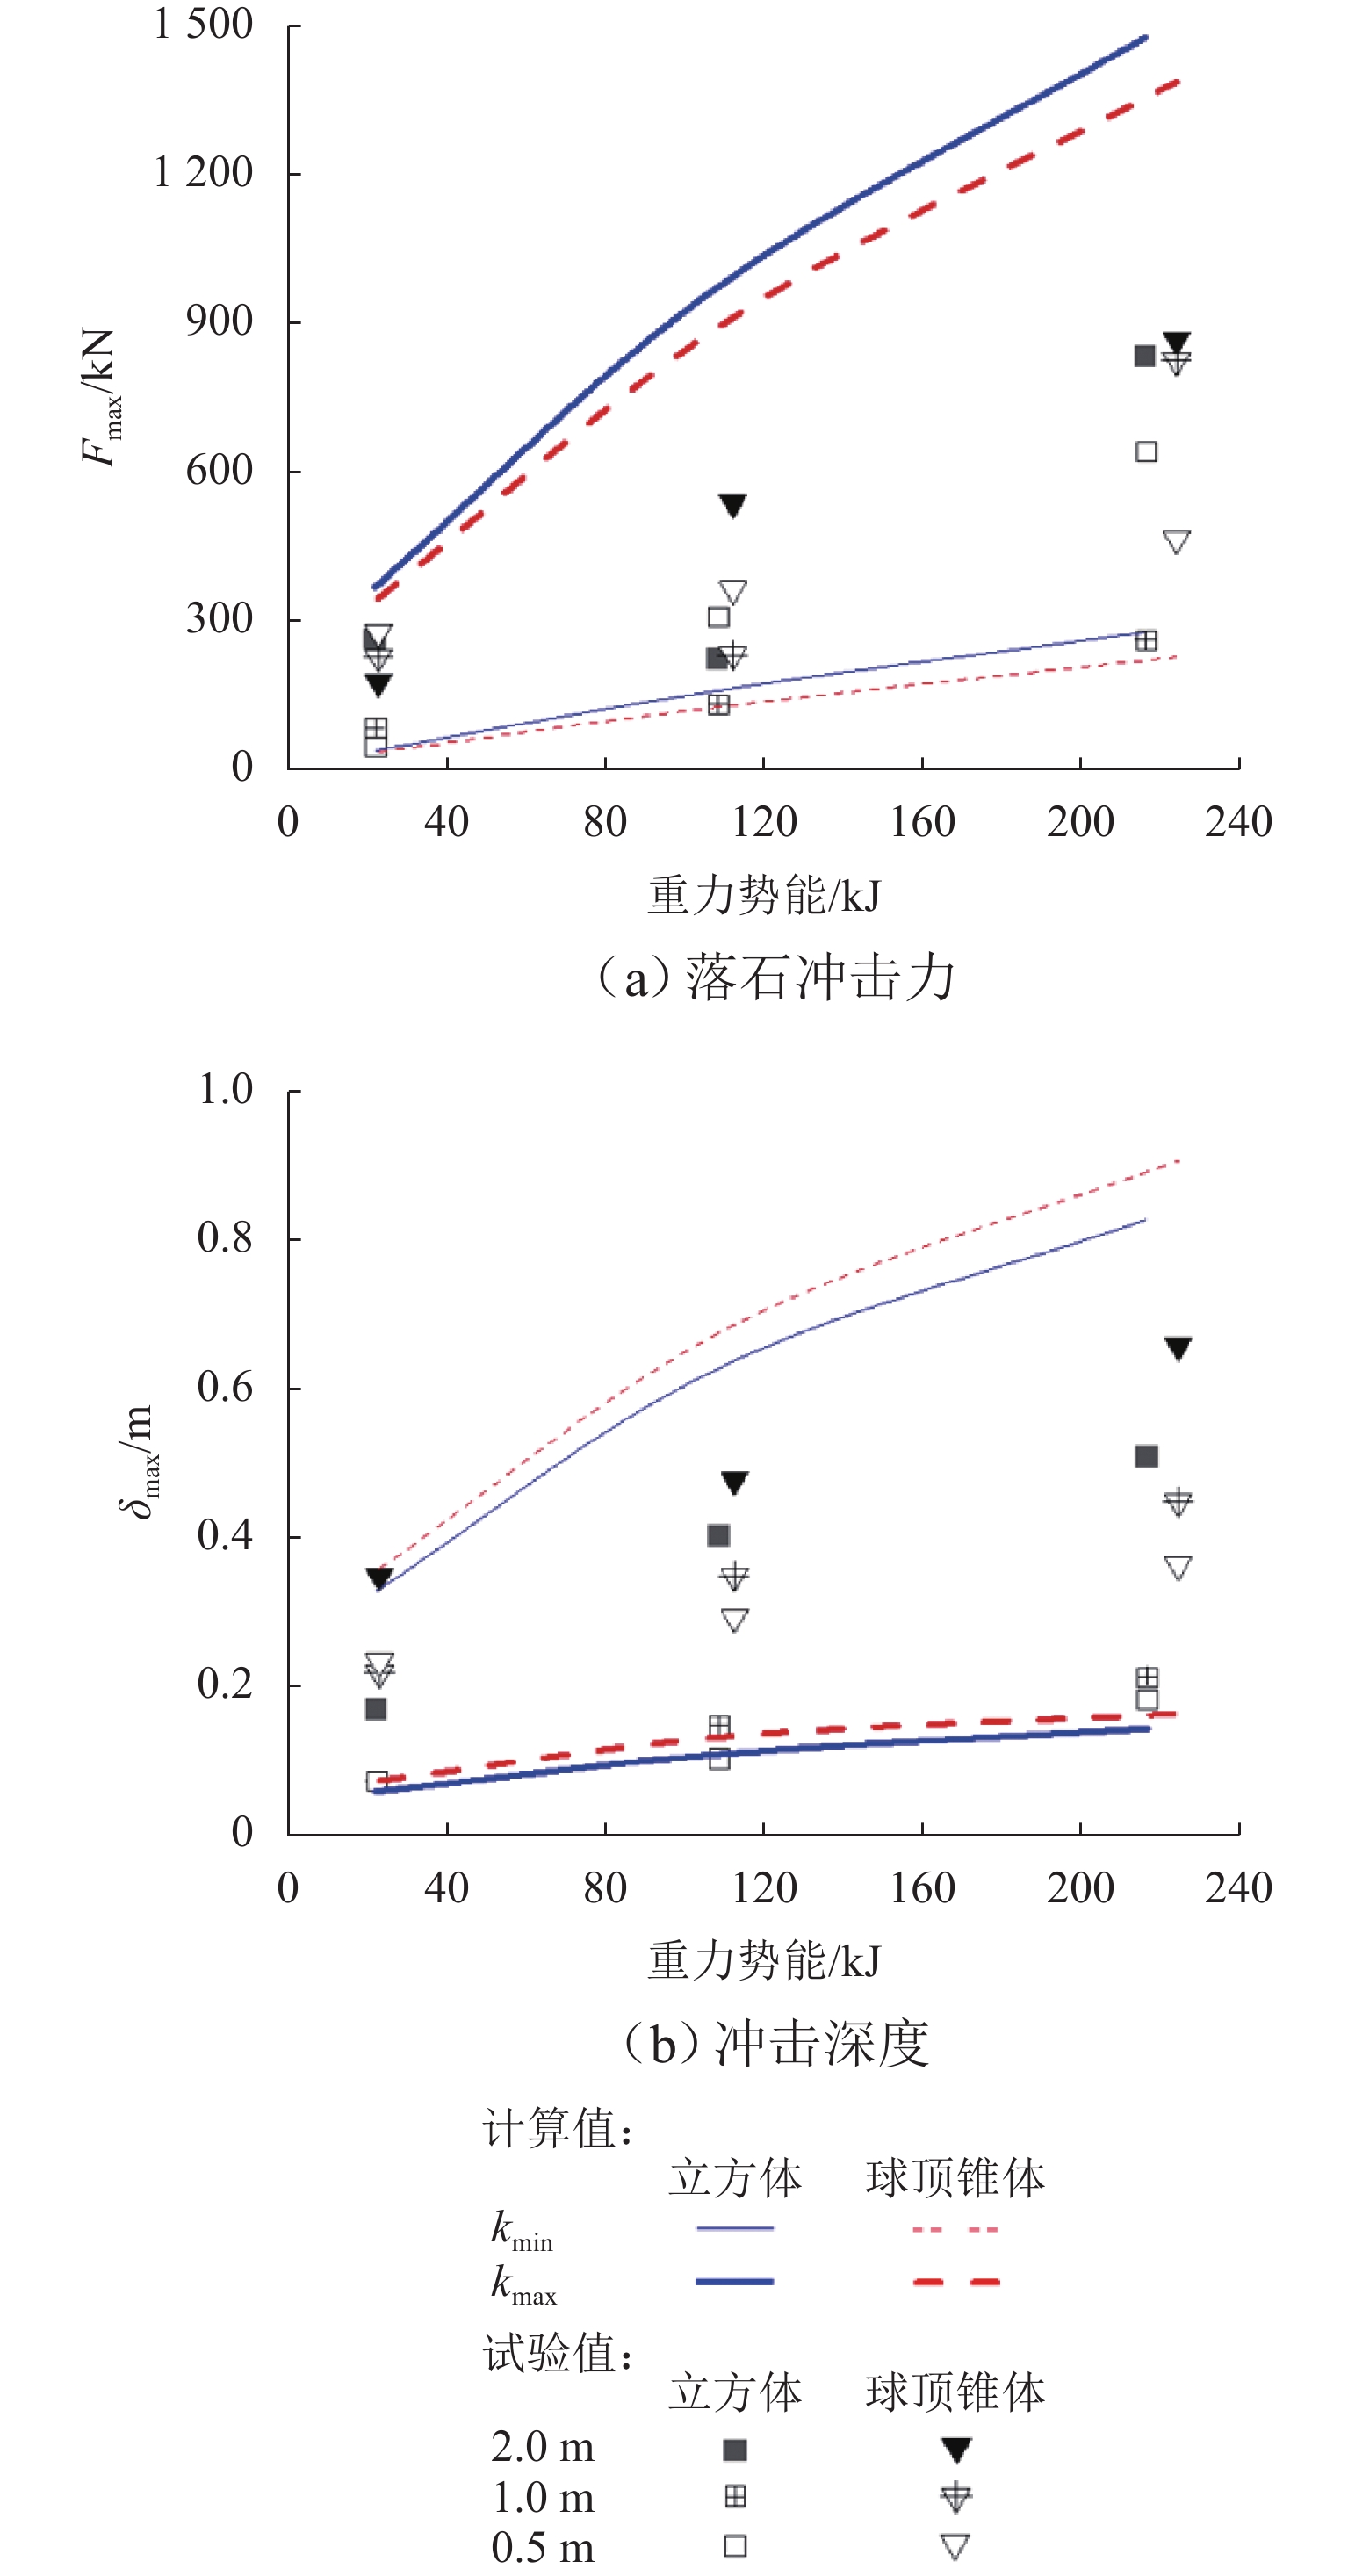
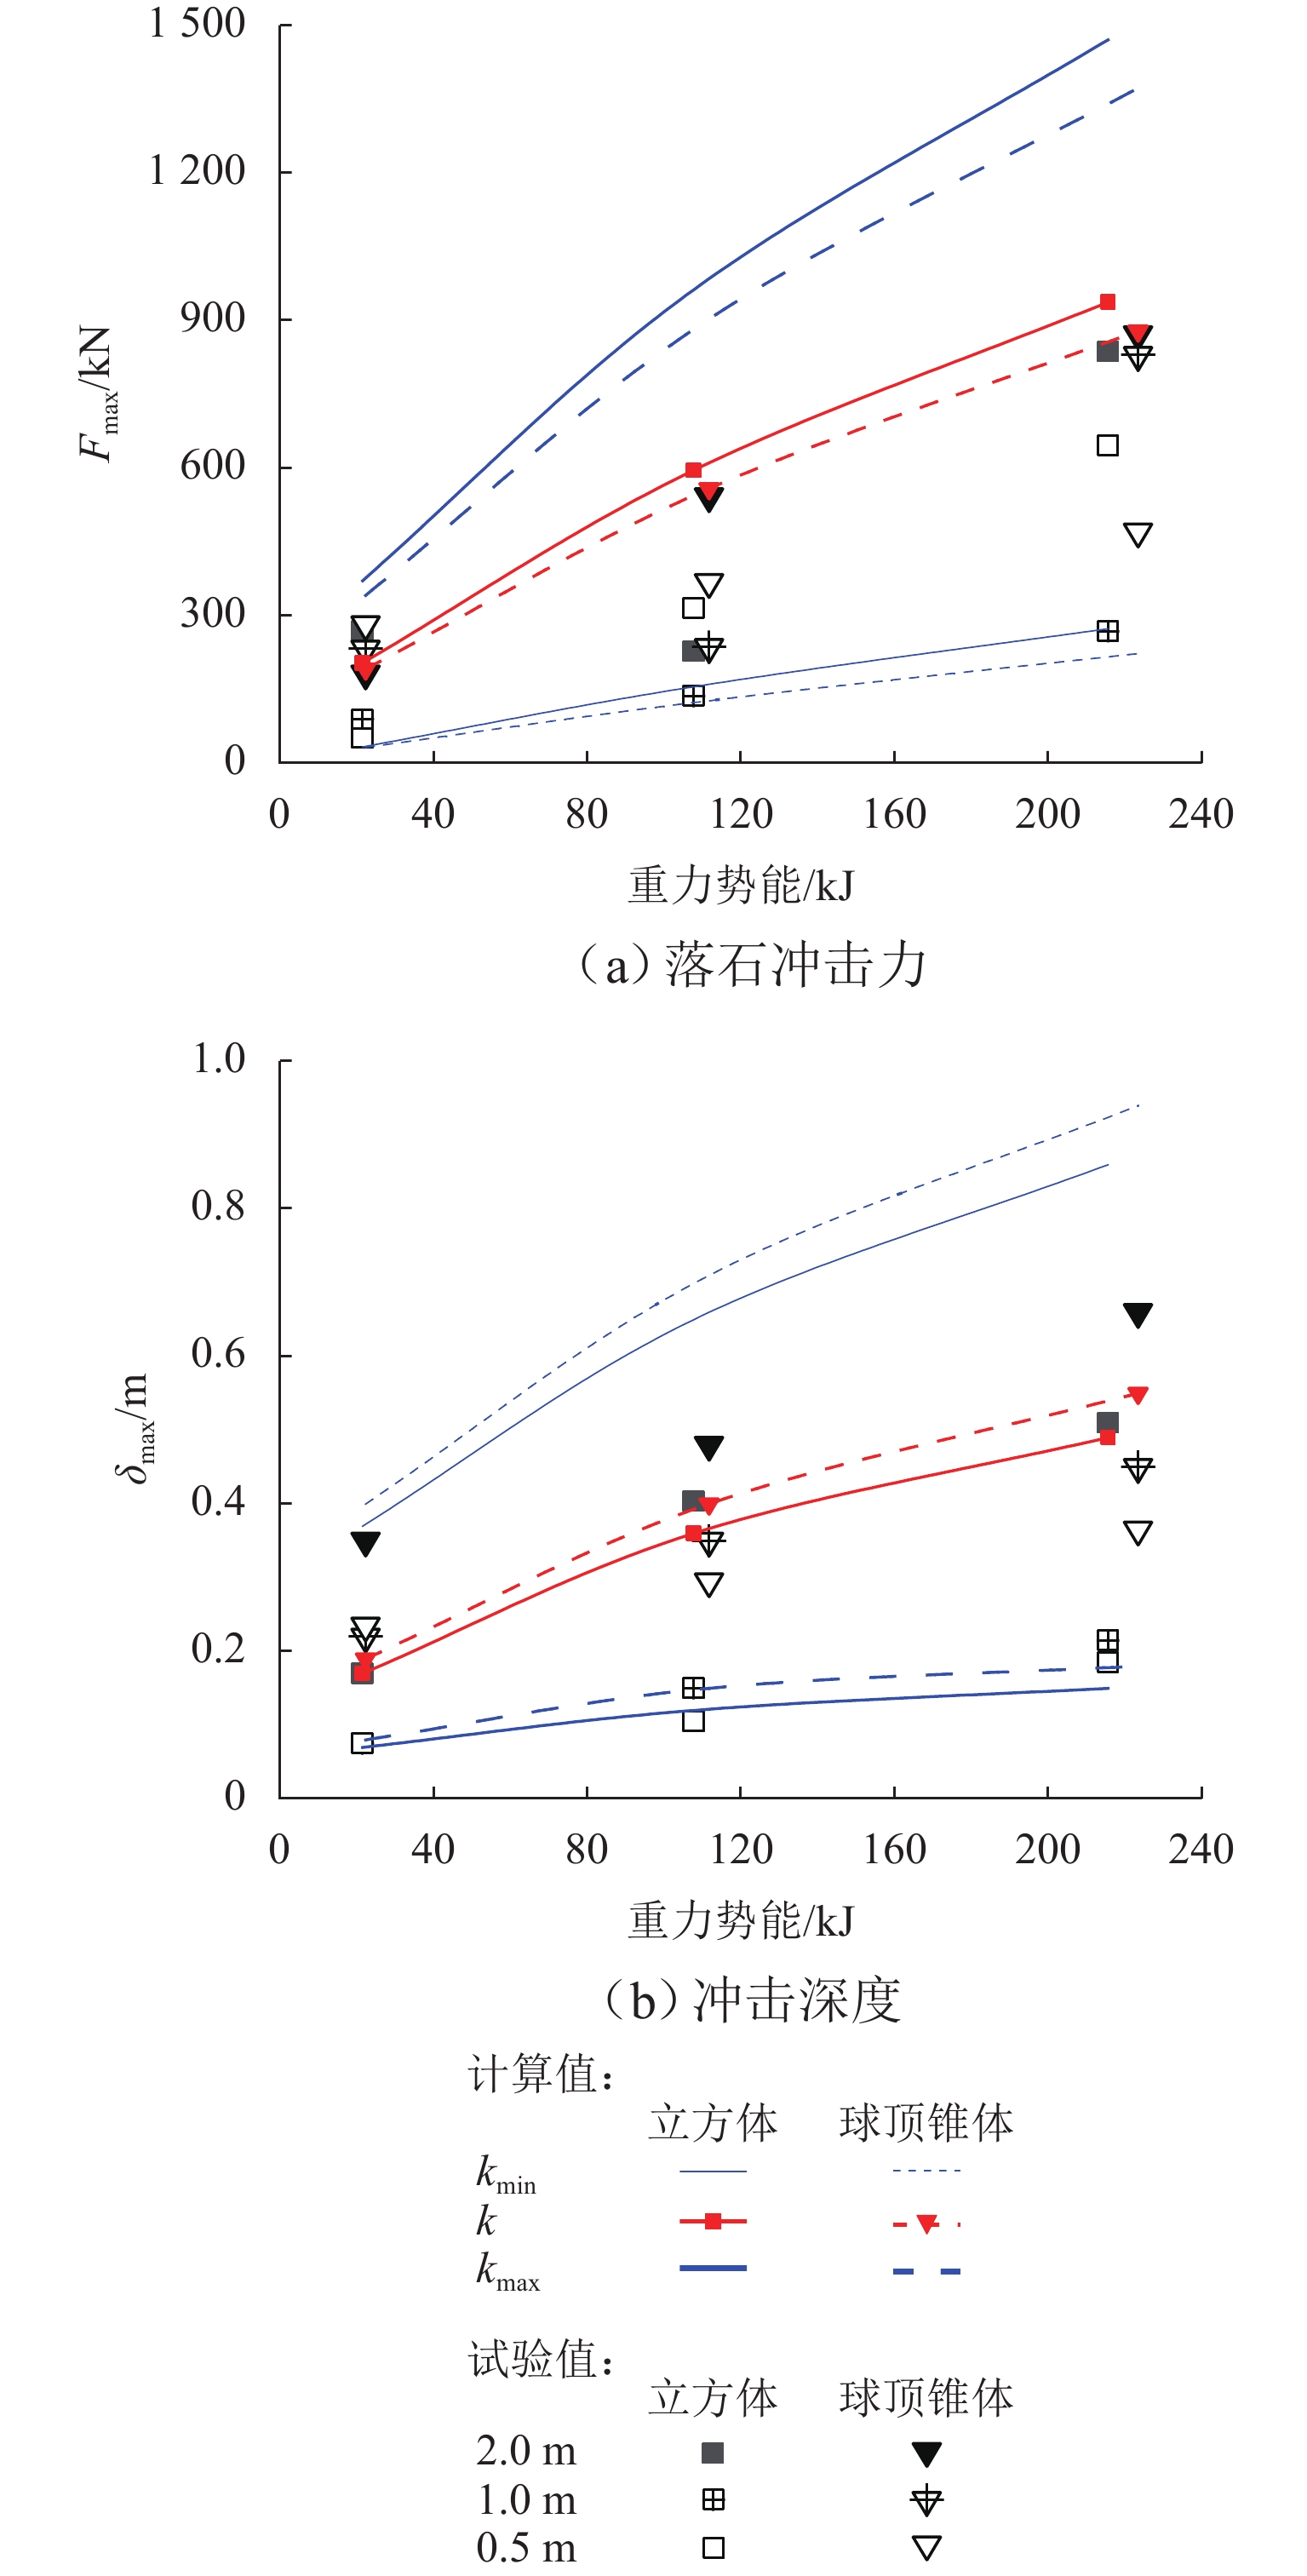
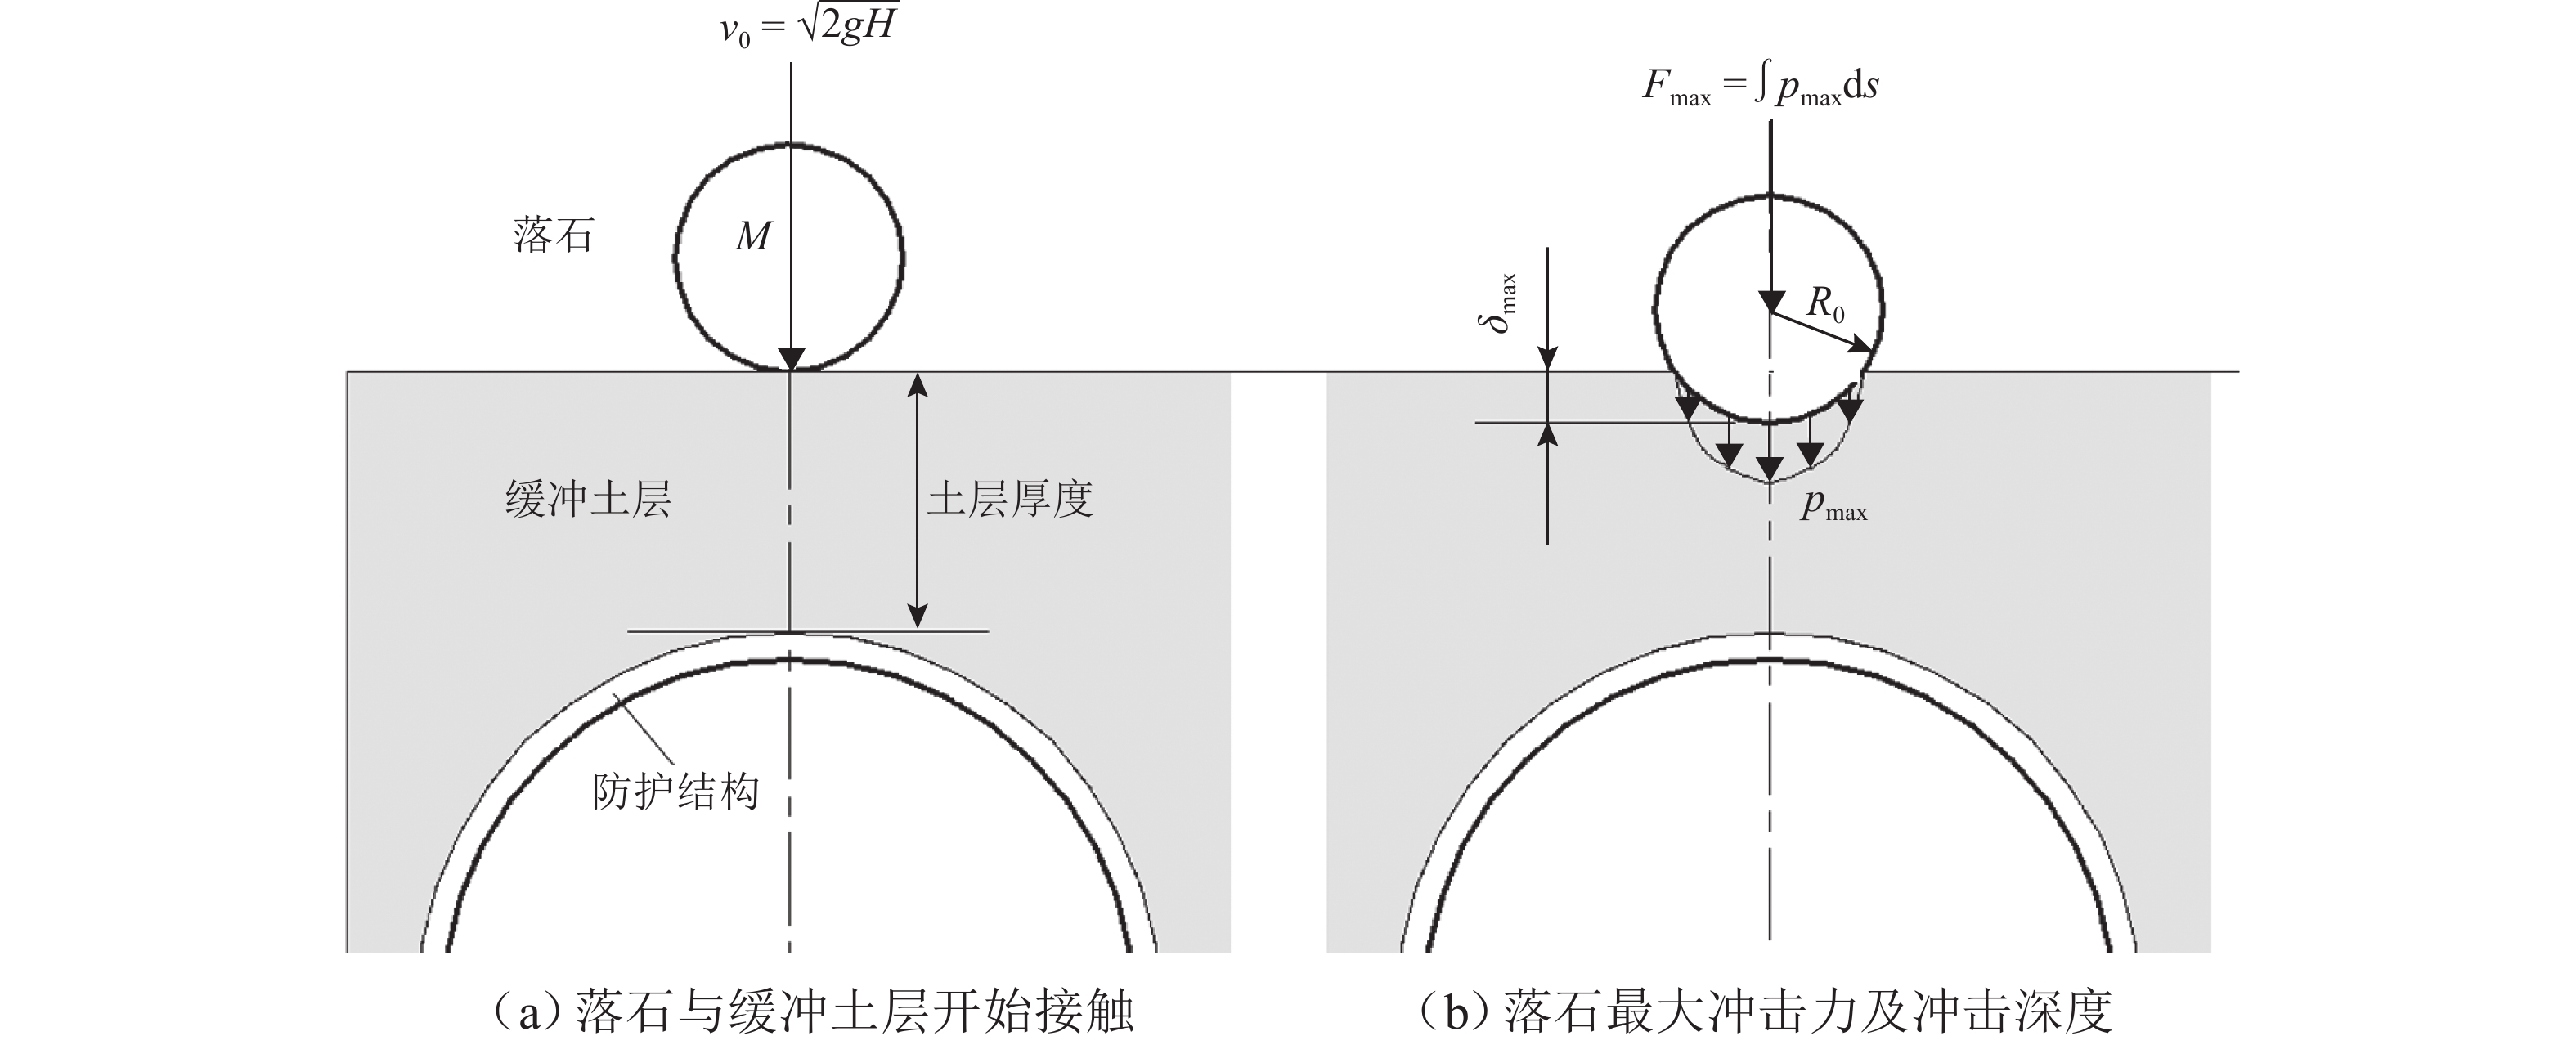
为阐明基于Hertz接触理论的落石冲击力、冲击深度计算方法及缓冲土层强化系数确定方法的适用性和可行性,通过足尺模型试验、反演分析及数理统计,开展体积约1 m3重约2 t的立方体和球顶锥体2种落石形状、1~10 m下落高度及0.5~2.0 m缓冲土层厚度的落石冲击试验研究,进行砂土缓冲层强化系数的确定及落石冲击力、冲击深度理论与试验结果的对比分析. 研究结论表明:根据试验结果反演分析,99.7%置信区间的砂土缓冲层强化系数建议取值范围为0.25~10.00 GN/m5/2;理论计算得到的立方体落石冲击力均值较试验值平均偏大140%,球顶锥体偏大21%;理论计算得到的立方体落石冲击深度均值较试验值平均偏大112%,球顶锥体偏大5%;在强化系数99.7%置信区间内计算得到的落石冲击力和冲击深度范围值可包含全部的落石冲击力和冲击深度;相同条件下球顶锥体落石的冲击深度试验值大于立方体的冲击深度试验值,缓冲层厚度越大时冲击深度增大,而落石冲击力离散性较大,与落石形状和缓冲层厚度无明显相关性.
Abstract:To elucidate the applicability and feasibility of the calculation methods for impact force and impact depth of falling rocks based on Hertz contact theory, as well as the determination method for the reinforcement coefficient of buffering soil layers, full-scale model tests, inversion analysis, and mathematical statistics methods were employed. The falling rock impact tests were carried out, involving cubic rock and conical rock with a spherical top, each with a volume of approximately 1 m³ and a weight of about 2 t. They were dropped from heights ranging from 1 to 10 m onto buffering soil layers with thicknesses of 0.5–2 m. Then, the reinforcement coefficient of buffering sand layers was determined, and theoretical and test results for impact force and impact depth of falling rocks were comparatively analyzed. The research conclusions are as follows: Based on inversion analysis of the test results, it is recommended that the reinforcement coefficient of buffering sand layers within the 99.7% confidence interval should range from 0.25 GN/m5/2 to 10.00 GN/m5/2. The theoretically calculated average impact force of cubic rock is 140% larger than the test value, while that of conical rock with a spherical top is 21% larger than the test value. The theoretically calculated average impact depth of cubic rock is 112% larger than the test value, while that of conical rock with a spherical top is 5% larger than the test value. Within the 99.7% confidence interval of the reinforcement coefficient, the range of calculated impact force and impact depth of rock can encompass 100% of the test results. Under the same conditions, the test value of the impact depth of conical rock with a spherical top is greater than that of cubic rock. The impact depth increases with the increase in the thickness of the buffering layer, while the variability in the impact force of falling rocks shows no significant correlation with the rock shape and buffering layer thickness.
-
表 1 落石冲击试验工况
Table 1. Impact test conditions for falling rocks
落石形状 工况 缓冲层厚度/m H/m 立方体 1 2.0 1 2 2.0 5 3 2.0 10 4 1.0 1 5 1.0 5 6 1.0 10 7 0.5 1 8 0.5 5 9 0.5 10 球顶锥体 10 2.0 1 11 2.0 5 12 2.0 10 13 1.0 1 14 1.0 5 15 1.0 10 16 0.5 1 17 0.5 5 18 0.5 10 表 2 土体参数
Table 2. Soil parameters
名称 取值 c/kPa 2 φ/(°) 20 E/(MN·m−2) 4 μ 0.39 重度 γ/(kN·m−3) 14.9 表 3 试验与理论结果
Table 3. Test and theoretical results
工况 amax/
(m·s−2)试验值 理论值 Fmax/kN δmax/m Fmax/kN δmax/m kmin kmax kmin kmax 1 120.97 266.13 0.17 41.70 371.27 0.33 0.06 2 102.76 226.07 0.40 162.00 975.16 0.63 0.11 3 379.79 835.54 0.51 280.00 1480.00 0.83 0.15 4 39.50 86.90 0.08 41.70 371.27 0.33 0.06 5 61.18 134.60 0.15 162.00 975.16 0.63 0.11 6 121.11 266.44 0.22 280.00 1480.00 0.83 0.15 7 22.40 49.28 0.08 41.70 371.27 0.33 0.06 8 142.56 313.63 0.11 162.00 975.16 0.63 0.11 9 293.10 644.69 0.19 280.00 1480.00 0.83 0.15 10 79.23 180.64 0.35 38.30 348.05 0.36 0.08 11 237.22 540.87 0.48 133.00 914.15 0.69 0.14 12 381.71 870.29 0.66 230.00 1390.00 0.91 0.17 13 101.30 230.96 0.22 38.30 348.05 0.36 0.08 14 106.52 234.34 0.35 133.00 914.15 0.69 0.14 15 376.43 828.14 0.45 230.00 1390.00 0.91 0.17 16 127.53 280.58 0.24 38.30 348.05 0.36 0.08 17 166.60 366.51 0.30 133.00 914.15 0.69 0.14 18 213.22 469.09 0.37 230.00 1390.00 0.91 0.17 表 4 相关性分析
Table 4. Correlation analysis
因变量 分析项 落石形状 缓冲层厚度 H 落石冲击力 冲击深度 落石冲击力 皮尔逊相关性 0.258 0.253 0.769** 1 0.751** 显著性 (双尾) 0.301 0.311 0.000 0.000 个案数 18 18 18 18 18 冲击深度 皮尔逊相关性 0.531* 0.585* 0.541* 0.751** 1 显著性 (双尾) 0.023 0.011 0.020 0.000 个案数 18 18 18 18 18 注:*. 在 0.05 级别 (双尾) , 相关性显著;**. 在 0.01 级别 (双尾) , 相关性显著. 表 5 砂土缓冲层k值
Table 5. k value for buffering sand layer
GN/m5/2 工况 k 工况 k 工况 k 1 2.26 7 1.42 13 1.65 2 0.518 8 5.50 14 0.83 3 1.50 9 5.79 15 1.80 4 2.52 10 0.64 16 1.61 5 1.37 11 1.20 17 1.68 6 1.78 12 1.19 18 1.38 表 6 正态性检验
Table 6. Normality test
变量 柯尔莫戈洛夫-斯米诺夫a 夏皮洛-威尔克 统计 自由度 显著性 统计 自由度 显著性 k 0.312 18 0.000 0.703 18 0.000 lg k 0.196 18 0.066 0.923 18 0.148 注:a. 里利氏显著性修正(指在进行假设检验时, 当样本量较小或者总体方差未知时, 为保证检验结果的可靠性, 对原本的检验统计量进行修正, 使最终的检验结果更加准确). -
[1] 铁路工程设计技术手册——隧道[M]. 北京:中国铁道出版社,1999. [2] LABIOUSE V, DESCOEUDRES F, MONTANI S. Experimental study of rock sheds impacted by rock blocks[J]. Structural Engineering International, 1996, 6(3): 171-176. doi: 10.2749/101686696780495536 [3] Japan Road Association. Handbook for rockfall measures[M]. Japan: Maruzen Publishing, 2000: 10-22. [4] PICHLER B, HELLMICH C, MANG H A, et al. Impact of rocks onto gravel design and evaluation of experiments[J]. International Journal of Impact Engineering, 2005, 31(5): 559-578. doi: 10.1016/j.ijimpeng.2004.01.007 [5] 何思明,吴永,李新坡. 颗粒弹塑性碰撞理论模型[J]. 工程力学,2008,25(12): 19-24.HE Siming, WU Yong, LI Xinpo. Theoretical model on elastic-plastic granule impact[J]. Engineering Mechanics, 2008, 25(12): 19-24. [6] 何思明. 滚石对防护结构的冲击压力计算[J]. 工程力学,2010,27(9): 175-180.HE Siming. Calculation of compact pressure of rock-fall on shield structures[J]. Engineering Mechanics, 2010, 27(9): 175-180. [7] WANG Y S, XU M, YANG C, et al. Effects of elastoplastic strengthening of gravel soil on rockfall impact force and penetration depth[J]. International Journal of Impact Engineering, 2020, 136: 103411.1-103411.14. [8] JOHNSON K L. Contact mechanics[M]. Cambridge: Springer, 1985. [9] THORNTON C. Coefficient of restitution for collinear collisions of elastic-perfectly plastic spheres[J]. Journal of Applied Mechanics, 1997, 64(2): 383-386. doi: 10.1115/1.2787319 [10] THORNTON C, NING Z M. A theoretical model for the stick/bounce behaviour of adhesive, elastic-plastic spheres[J]. Powder Technology, 1998, 99(2): 154-162. doi: 10.1016/S0032-5910(98)00099-0 [11] BRIZMER V, KLIGERMAN Y, ETSION I. The effect of contact conditions and material properties on the elasticity terminus of a spherical contact[J]. International Journal of Solids and Structures, 2005, 43(18/19): 5736-5749. [12] 中华人民共和国住房和城乡建设部. 土工试验方法标准:GB/T 50123—2019[S]. 北京:中国计划出版社,2019. [13] 王玉锁. 砂质土隧道围岩力学参数及分级方法研究[D]. 成都:西南交通大学,2008. [14] 黄晓玉,王兰会. SPSS 24.0统计分析[M]. 北京:中国人民大学出版社,2021. [15] 吴建利,胡卸文,梅雪峰,等. 落石冲击混凝土板与缓冲层组合结构的动力响应[J]. 水文地质工程地质,2021,48(1): 78-87.WU Jianli, HU Xiewen, MEI Xuefeng, et al. Dynamic response of RC slab with cushion layer composed of sandy soil to rockfall impact[J]. Hydrogeology & Engineering Geology, 2021, 48(1): 78-87. [16] SONG B, CHEN W N, LUK V. Impact compressive response of dry sand[J]. Mechanics of Materials, 2009, 41(6): 777-785. doi: 10.1016/j.mechmat.2009.01.003 [17] BRAGOV A, LOMUNOV A, SERGEICHEV I, et al. Determination of physicomechanical properties of soft soils from medium to high strain rates[J]. International Journal of Impact Engineering, 2007, 35(9): 967-976. [18] BARR A D, CLARKE S D, PETKOVSKI M, et al. Effects of strain rate and moisture content on the behaviour of sand under one-dimensional compression[J]. Experimental Mechanics, 2016, 56(9): 1625-1639. doi: 10.1007/s11340-016-0200-z [19] HAN B Y, LING J M, SHU X, et al. Quantifying the effects of geogrid reinforcement in unbound granular base[J]. Geotextiles and Geomembranes, 2019, 47(3): 369-376. doi: 10.1016/j.geotexmem.2019.01.009 [20] CUI X Z, WANG Y L, LIU K W, et al. A simplified model for evaluating the hardening behaviour of sensor-enabled geobelts during pullout tests[J]. Geotextiles and Geomembranes, 2019, 47(3): 377-388. doi: 10.1016/j.geotexmem.2019.01.007 -


 下载:
下载:
