

Determination of Influence Range of Urban Traffic Congestion and Identification of Key Road Sections
-
摘要:
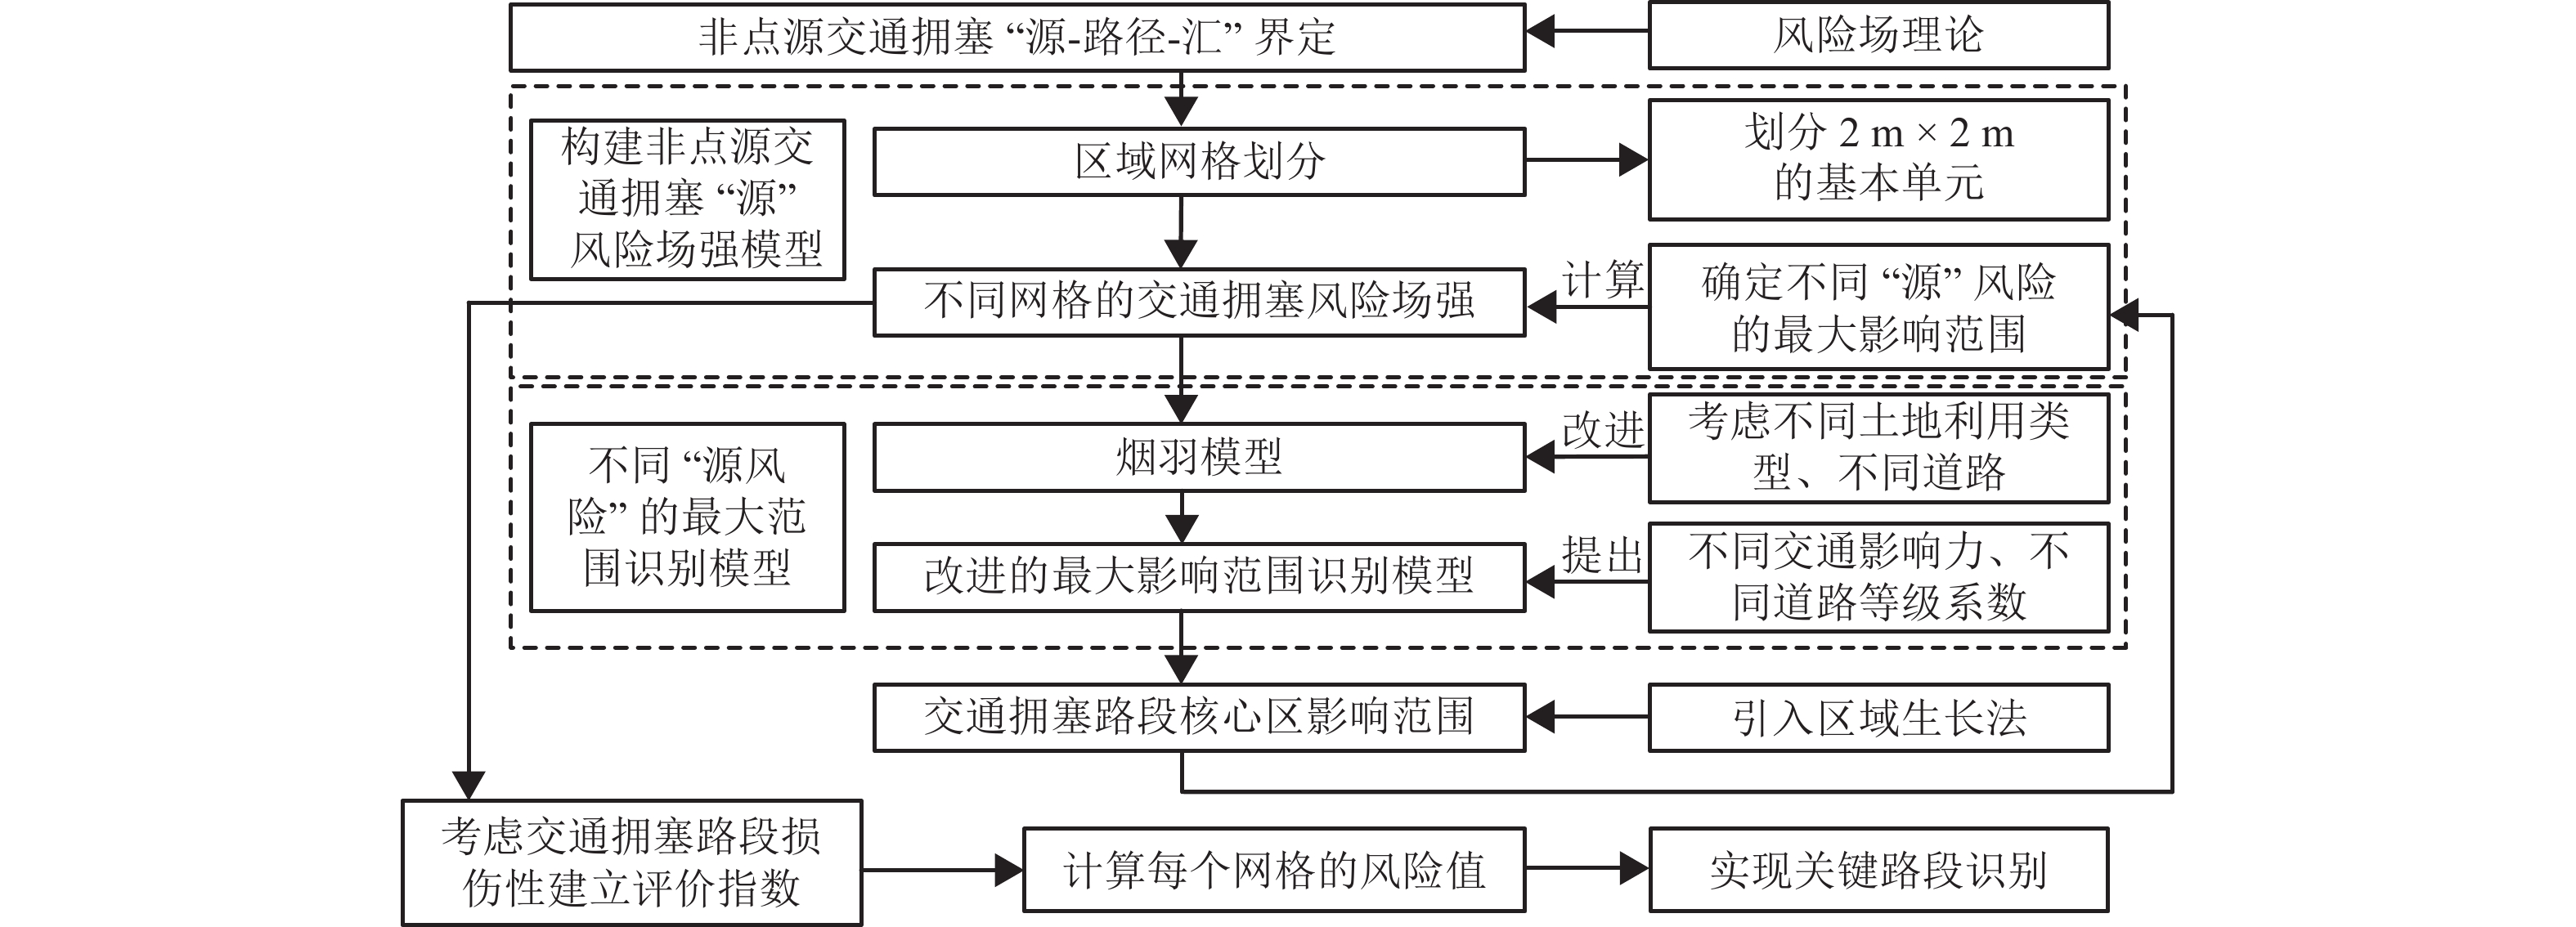
为研究非点源交通拥塞的影响范围及关键路段识别,引入风险场强理论、区域生长法对烟羽模型进行适应性改进,以确定最大、核心影响范围及识别关键路段. 首先,对非点源交通拥塞的“源-路径-汇”进行界定,以2021年贵阳市的交通调查数据、交通状态数据等为基础,构建非点源交通拥塞的“源”风险场强模型;考虑不同土地利用性质的交通影响力及不同道路等级调整系数并进行标定,建立基于不同“源”风险的最大影响范围识别模型,引入区域生长法建立路段核心区影响范围确定模型;最后,以路段交通量、长度、时间构建交通拥塞路段损伤性评价指数并对交通拥塞程度进行定量化研究,对原有模型、改进模型及实际情况进行对比分析. 结果表明:不同土地利用性质和不同道路等级对路段交通拥塞影响程度不同;改进后的不同“源”风险影响范围识别模型有效性较强,且预测精度提高3.54%,更接近实际情况;考虑区域生长法的路段交通拥塞核心区影响范围准确性更高,与实际情况仅相差2.66%. 综上所述,本研究为城市非点源交通拥塞累积性风险区范围划定和风险关键路径确定提供一种新的思路,对进一步开展不同交通拥塞发生类型的治理提供理论依据.
Abstract:In order to determine the influence range of non-point source traffic congestion and identify key road sections, the risk field strength theory and the regional growth method were introduced to improve the plume model. The maximum and core influence ranges were determined, and key road sections were identified. First, the “source-path-sink” of non-point source traffic congestion was defined, and the “source” risk field strength model of non-point source traffic congestion was constructed based on the traffic survey data and traffic status data in Guiyang in 2021. By considering the traffic influence of different land use properties and the adjustment coefficient of different road grades for calibration, the identification model of the maximum influence range was established based on different “source” risks, and the regional growth method was introduced to establish a model for determining the influence range of the core area of the road section. Finally, based on the traffic volume, length, and time of the road section, the damage evaluation index of the road section with traffic congestion was constructed, and quantitative research on the degree of traffic congestion was carried out. The original model, the improved model, and the actual situation were compared. The results show that different land use properties and different road grades have different influences on traffic congestion in road sections. The improved identification model of influence range based on different “source” risks is more effective, and the prediction accuracy is increased by 3.54%, which is closer to the actual situation. With the regional growth method, the accuracy of the influence range of the core area of the road section with traffic congestion is higher, which is 2.66% different from the actual situation. In summary, a new idea for the delineation of the cumulative risk range of urban non-point source traffic congestion and the determination of key risk paths is provided, also serving as a theoretical basis for further governance of different types of traffic congestion.
-
Key words:
- traffic engineering /
- regional growth method /
- risk evaluation /
- traffic congestion /
- damage
-

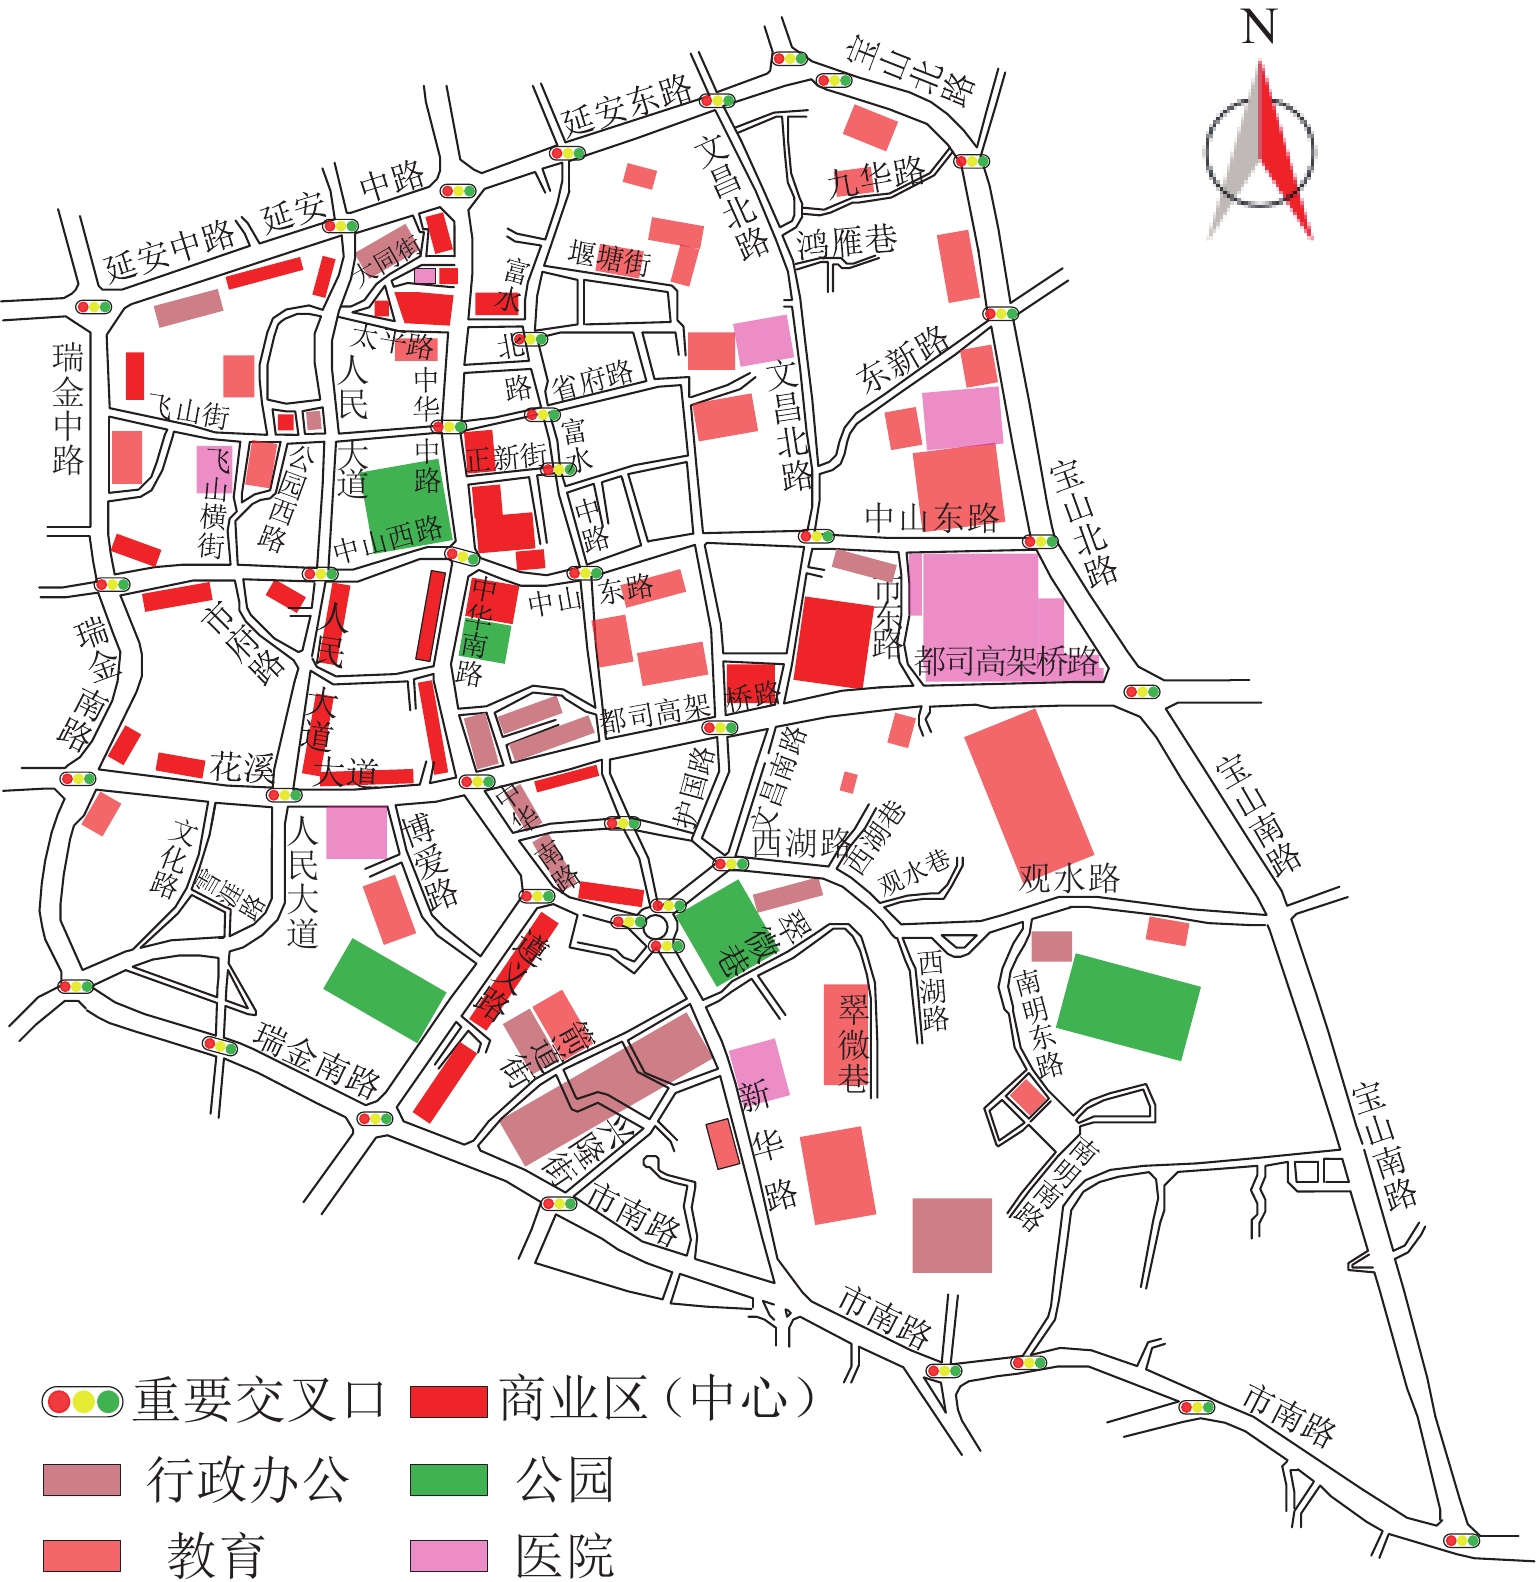
图 3 不同土地利用性质的“源-路径-汇”风险示意
Figure 3. “Source-path-sink” risks of different land use properties
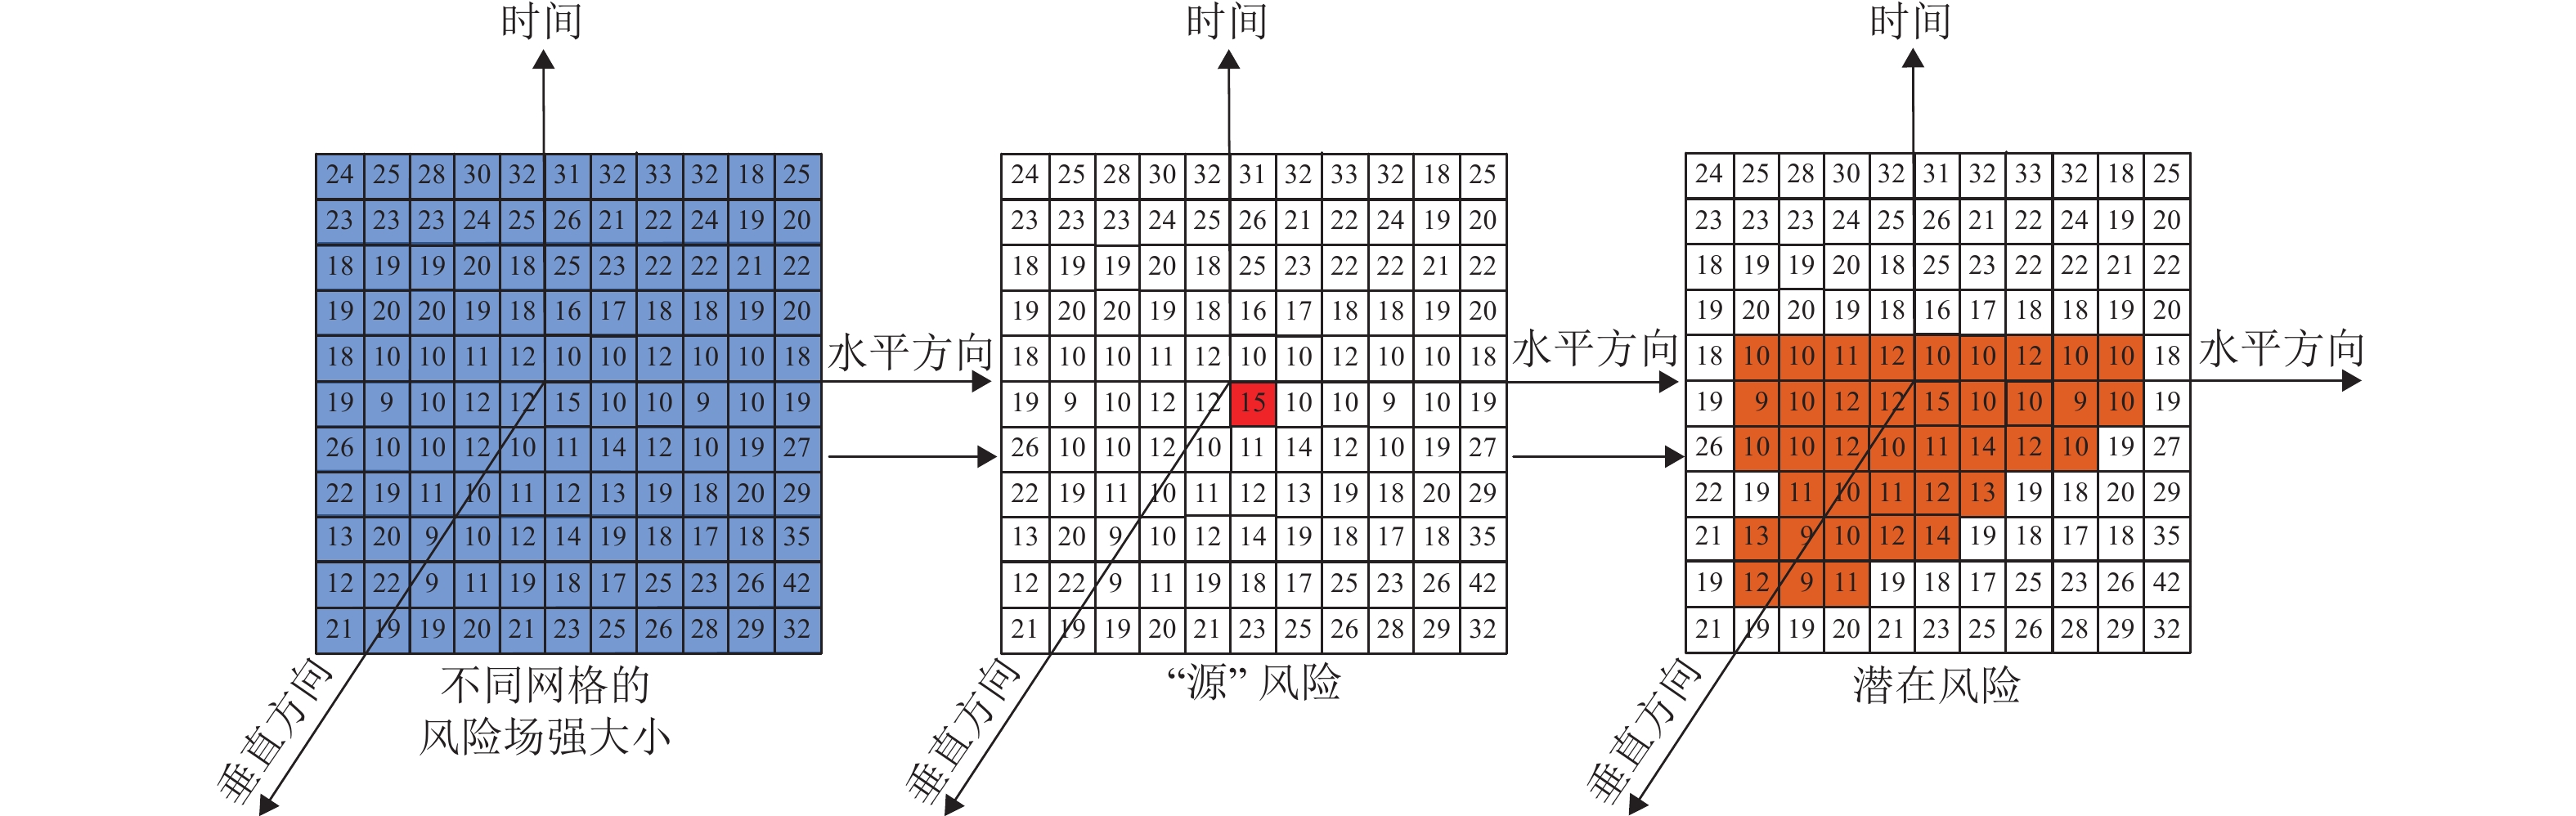
图 4 交通拥塞“源”风险核心范围确定方法
Figure 4. Method for determining core range of “source” risk for traffic congestion
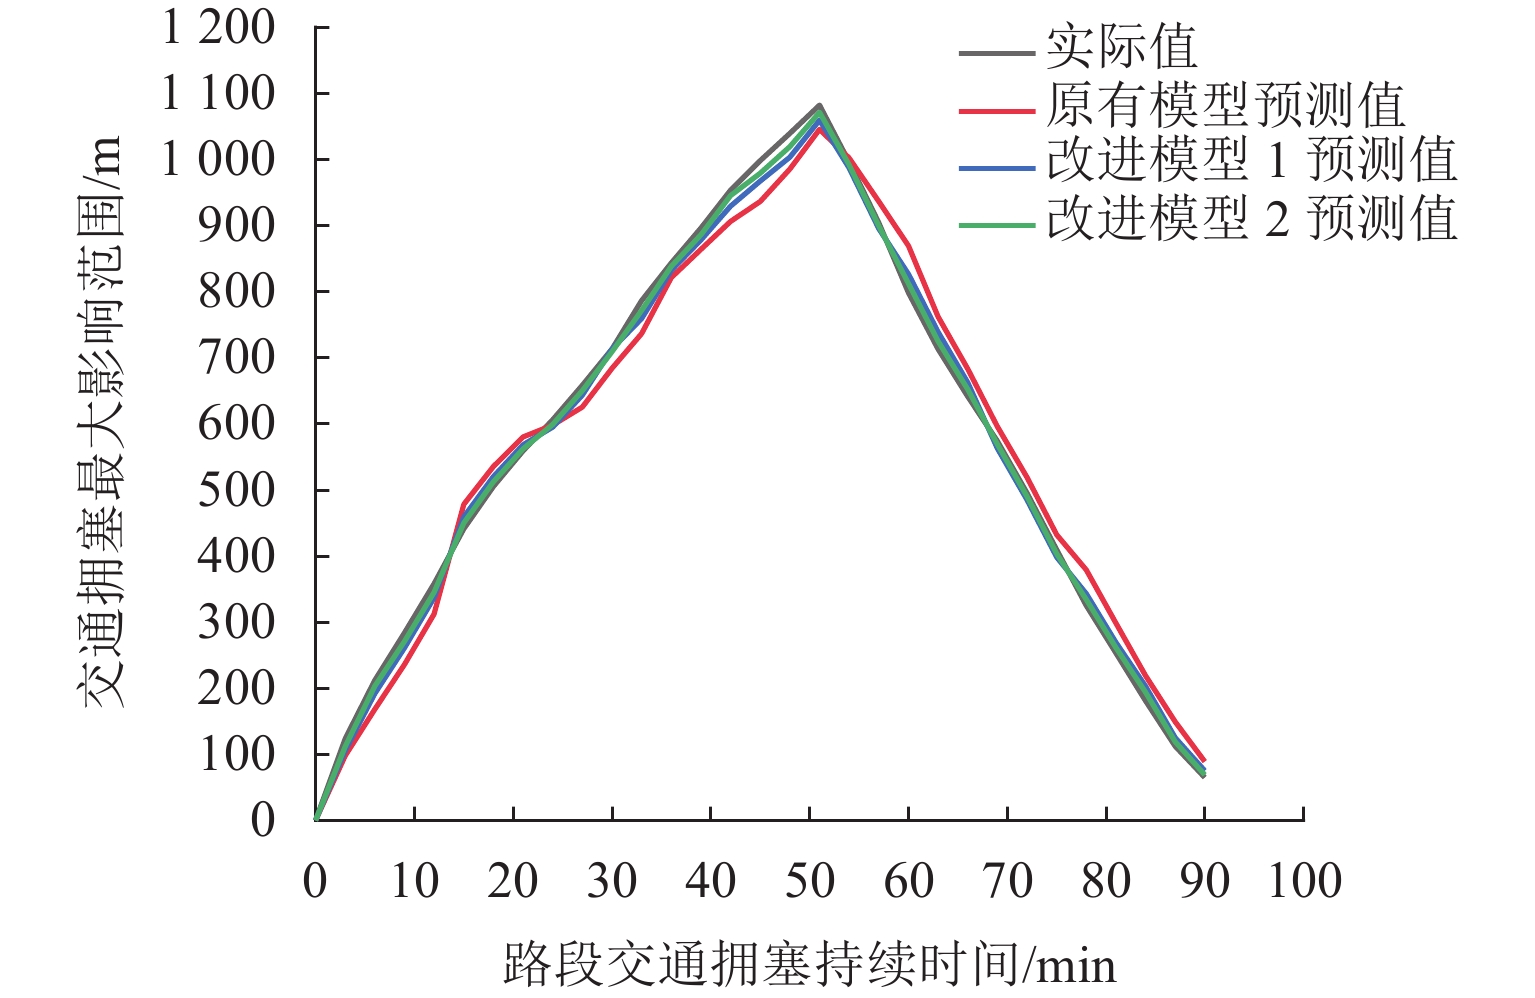
图 5 原有模型预测、改进模型预测及实际情况对比分析
Figure 5. Comparative analysis of original model prediction, improved model prediction, and actual situation

图 6 原有模型预测、改进模型预测及实际情况路段拥塞对比分析
Figure 6. Comparative analysis of original model prediction, improved model prediction and actual road congestion
表 1 研究区域内高峰小时道路基本情况
Table 1. Basic conditions of roads during peak hours in study area
编号 道路名称 道路等级 车道数 交通量/
(辆·h−1)通行能力/
(辆·h−1)饱和度 平均行车速度/
(km·h−1)1 延安中路 主干路 双向 8 车道 3208 3718 0.863 29.87 2 延安东路 主干路 双向 8 车道 3250 3718 0.874 29.35 3 宝山北路 城市快速路 双向 8 车道 + 潮汐车道 3995 4837 0.826 41.23 4 宝山南路 城市快速路 双向 8 车道 + 潮汐车道 4019 4837 0.831 40.85 5 市南路 城市快速路 双向 8 车道 3902 4375 0.892 42.31 6 瑞金中路 主干路 双向 6 车道 2670 2990 0.893 28.06 7 瑞金南路 主干路 双向 6 车道 2727 2990 0.912 27.86 8 人民大道 主干路 双向 6 车道 2637 2990 0.882 28.15 9 中山西路 主干路 双向 6 车道 2450 2990 0.836 29.86 10 中山东路 主干路 双向 6 车道 2448 2990 0.819 30.34 11 中华中路 主干路 双向 8 车道 3093 3718 0.832 28.36 12 中华南路 主干路 双向 8 车道 3142 3718 0.845 29.12 13 富水北路 支路 单向 4 车道 1547 1673 0.925 25.36 14 富水中路 主路 单向 3 车道 1218 1345 0.906 23.98 15 遵义路 次干路 双向 6 车道 1708 2055 0.831 29.26 16 新华路 次干路 双向 6 车道 1662 2055 0.809 28.75 17 西湖路 次干路 双向 4 车道 1200 1455 0.825 27.56 18 博爱路 支路 双向 2 车道 452 504 0.897 20.28 19 文化路 支路 双向 2 车道 448 504 0.889 19.32 20 观水路 次干路 双向 4 车道 1312 1455 0.902 28.14 21 南明南路 支路 双向 2 车道 431 504 0.856 18.97 22 都司高架桥路 主干路 双向 6 车道 2676 2990 0.895 29.43  下载: 导出CSV
表 2 交通拥塞风险路段损伤性指数划分
Table 2. Damage index classification of road sections with traffic congestion risk
指标描述 关系表述 权重 分值 风险等级 代表色 实际交通量 qs 和自由流情况下交通量 qf 的关系 qs ≤ 0.3qf 1/3 20 很低 ● 绿色0.3qf < qs ≤ 0.6qf 40 较低 ● 蓝色0.6qf < qs ≤ 0.7qf 60 中等 ● 黄色0.7qf < qs ≤ 0.8qf 80 较高 ● 橙色0.8qf < qs ≤ 1.0qf 100 很高 ● 红色道路拥塞长度 lf 和道路实际长度 ls 的关系 lf ≤ 0.04ls 1/3 20 很低 ● 绿色0.04ls < lf ≤ 0.08ls 40 较低 ● 蓝色0.08ls < lf ≤ 0.12ls 60 中等 ● 黄色0.12ls < lf ≤ 0.15ls 80 较高 ● 橙色0.15ls < lf 100 很高 ● 红色实际出行时间 ts 和自由流情况下出行时间 tf 的关系 ts ≤ 0.3tf 1/3 20 很低 ● 绿色0.3tf < ts ≤ 0.5tf 40 较低 ● 蓝色0.5tf < ts ≤ 0.6tf 60 中等 ● 黄色0.6tf < ts ≤ 0.7tf 80 较高 ● 橙色0.7tf < ts ≤ 1.0tf 100 很高 ● 红色交通拥塞综合评价指数CTC 0 ≤ C < 2.0 20 很低 ● 绿色2.0 ≤ C < 4.0 40 较低 ● 蓝色4.0 ≤ C < 6.0 60 中等 ● 黄色6.0 ≤ C < 8.0 80 较高 ● 橙色8.0 ≤ C 100 很高 ● 红色
下载: 导出CSV
表 3 模型参数标定
Table 3. Parameter calibration of model
不同土地利用类型描述 城市道路
类型$ \zeta $ $ \eta $ $ I_{\mathrm{d}} $/×10−8 最大影响范围/m 精度提升/% 实际情况 原有模型预测 改进模型 1 改进模型 2 改进模型 1 改进模型 2 医院 城市快速路 0.95 1.00 1.50 958 1002 979 965 2.40 3.86 主干路 0.95 1.35 886 932 865 872 2.82 3.61 次干路 0.75 1.08 691 756 719 709 5.35 6.80 商业区
(中心)城市快速路 1.00 1.00 1.82 1045 1098 1072 1062 2.49 3.44 主干路 0.95 1.43 912 972 931 925 4.50 5.15 次干路 0.75 1.15 712 782 685 701 6.04 8.29 学校 城市快速路 0.90 1.00 1.40 784 812 767 772 1.40 2.04 主干路 0.95 1.60 857 898 845 862 3.38 4.20 次干路 0.75 1.03 583 619 599 592 3.43 4.63
下载: 导出CSV
-
[1] JIANG P, LIU Z K, ZHANG L F, et al. Advanced traffic congestion early warning system based on traffic flow forecasting and extenics evaluation[J]. Applied Soft Computing, 2022, 118: 108554.1-108554.27. [2] WU J X, ZHOU X B, PENG Y, et al. Recurrence analysis of urban traffic congestion index on multi-scale[J]. Physica A: Statistical Mechanics and Its Applications, 2022, 585: 126439.1-426439.16. [3] NOOR M A, ASHRAFI S, FATTAH M A, et al. Assessment of traffic congestion scenario at the CBD areas in a developing city: in the context of Khulna City, Bangladesh[J]. Transportation Research Interdisciplinary Perspectives, 2021, 11: 110435.1-110435.11. [4] LUAN S, KE R M, HUANG Z, et al. Traffic congestion propagation inference using dynamic Bayesian graph convolution network[J]. Transportation Research Part C: Emerging Technologies, 2022, 135: 103526.1-103526.18. [5] WANG M S, DEBBAGE N. Urban morphology and traffic congestion: longitudinal evidence from US cities[J]. Computers, Environment and Urban Systems, 2021, 89: 101676.1-101676.11. [6] 黄建华,孙梦歌. 考虑出行者行为的多重网络拥堵风险传播模型[J]. 交通运输系统工程与信息,2021,21(1): 8-15.HUANG Jianhua, SUN Mengge. Multi-network congestion risk propagation model considering driver behavior[J]. Journal of Transportation Systems Engineering and Information Technology, 2021, 21(1): 8-15. [7] 王忠宇,王玲,王艳丽,等. 基于网络变结构优化的大型活动交通拥堵预防方法[J]. 浙江大学学报(工学版),2021,55(2): 358-366.WANG Zhongyu, WANG Ling, WANG Yanli, et al. Traffic congestion prevention method during large-scale special events based on variable network topology optimization[J]. Journal of Zhejiang University (Engineering Science), 2021, 55(2): 358-366. [8] 陈美林,郑治豪,郭宝,等. 基于因果关联的交通拥堵传播分析[J]. 中南大学学报(自然科学版),2020,51(12): 3575-3583. doi: 10.11817/j.issn.1672-7207.2020.12.031CHEN Meilin, ZHENG Zhihao, GUO Bao, et al. Traffic congestion spreading analysis based on causal nexus[J]. Journal of Central South University (Science and Technology), 2020, 51(12): 3575-3583. doi: 10.11817/j.issn.1672-7207.2020.12.031 [9] 邢永健,王旭,可欣,等. 基于风险场的区域突发性环境风险评价方法研究[J]. 中国环境科学,2016,36(4): 1268-1274. doi: 10.3969/j.issn.1000-6923.2016.04.044XING Yongjian, WANG Xu, KE Xin, et al. Method of regional acute environmental risk assessment based on risk field[J]. China Environmental Science, 2016, 36(4): 1268-1274. doi: 10.3969/j.issn.1000-6923.2016.04.044 [10] 王拯洲,李刚,王伟,等. 基于邻域向量主成分分析图像增强的弱小损伤目标检测方法[J]. 光子学报,2019,48(7): 75-86.WANG Zhengzhou, LI Gang, WANG Wei, et al. A method for detecting small and weak defect targets based on neighborhood vector PCA image enhancement[J]. Acta Photonica Sinica, 2019, 48(7): 75-86. [11] 王丽,刘小明,任福田,等. 烟羽模型在交通影响分析中的应用[J]. 公路交通科技,2001,18(6): 82-85. doi: 10.3969/j.issn.1002-0268.2001.06.022WANG Li, Liu Xiaoming, REN Futian, et al. The Application of Cloud Model in Traffic Impact Analysis[J]. Journal of Highway and Transportation Research and Development, 2001, 18(6): 82-85. doi: 10.3969/j.issn.1002-0268.2001.06.022 -

 下载:
下载:

 点击查看大图
计量
- 文章访问数: 425
- HTML全文浏览量: 244
- PDF下载量: 57
- 被引次数: 0