Influence of Location Frequency on Travel Mode Extraction Using Cellular Phone Data
-
摘要:
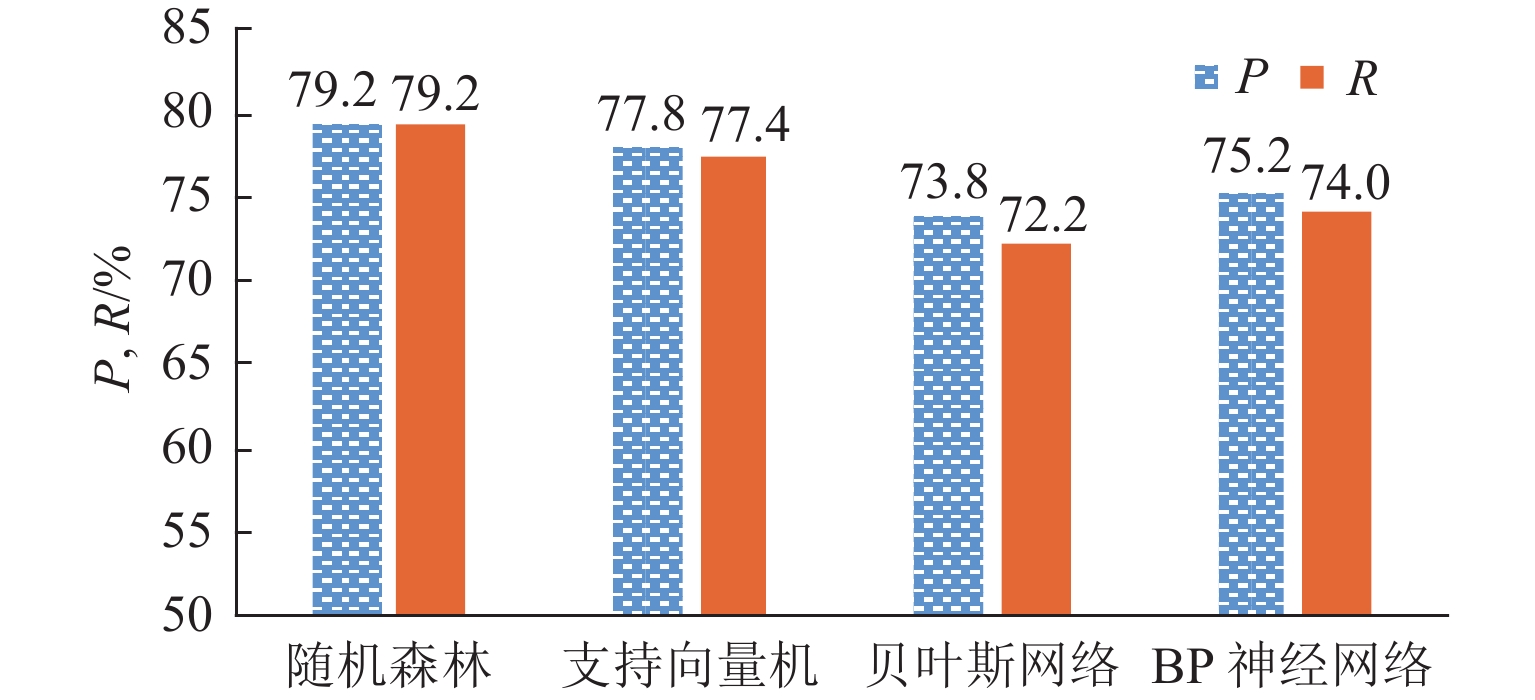
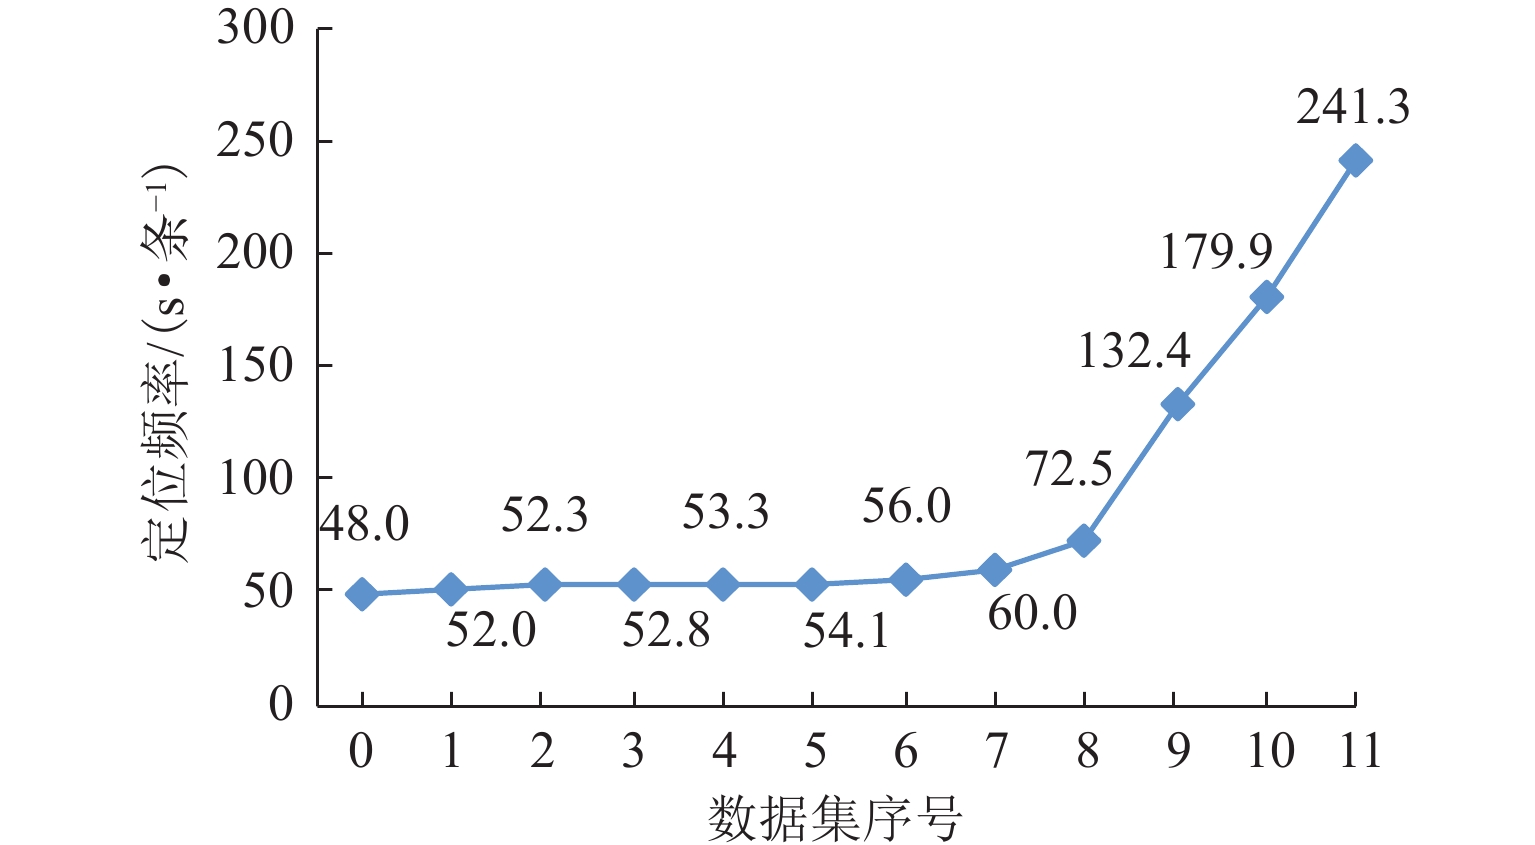
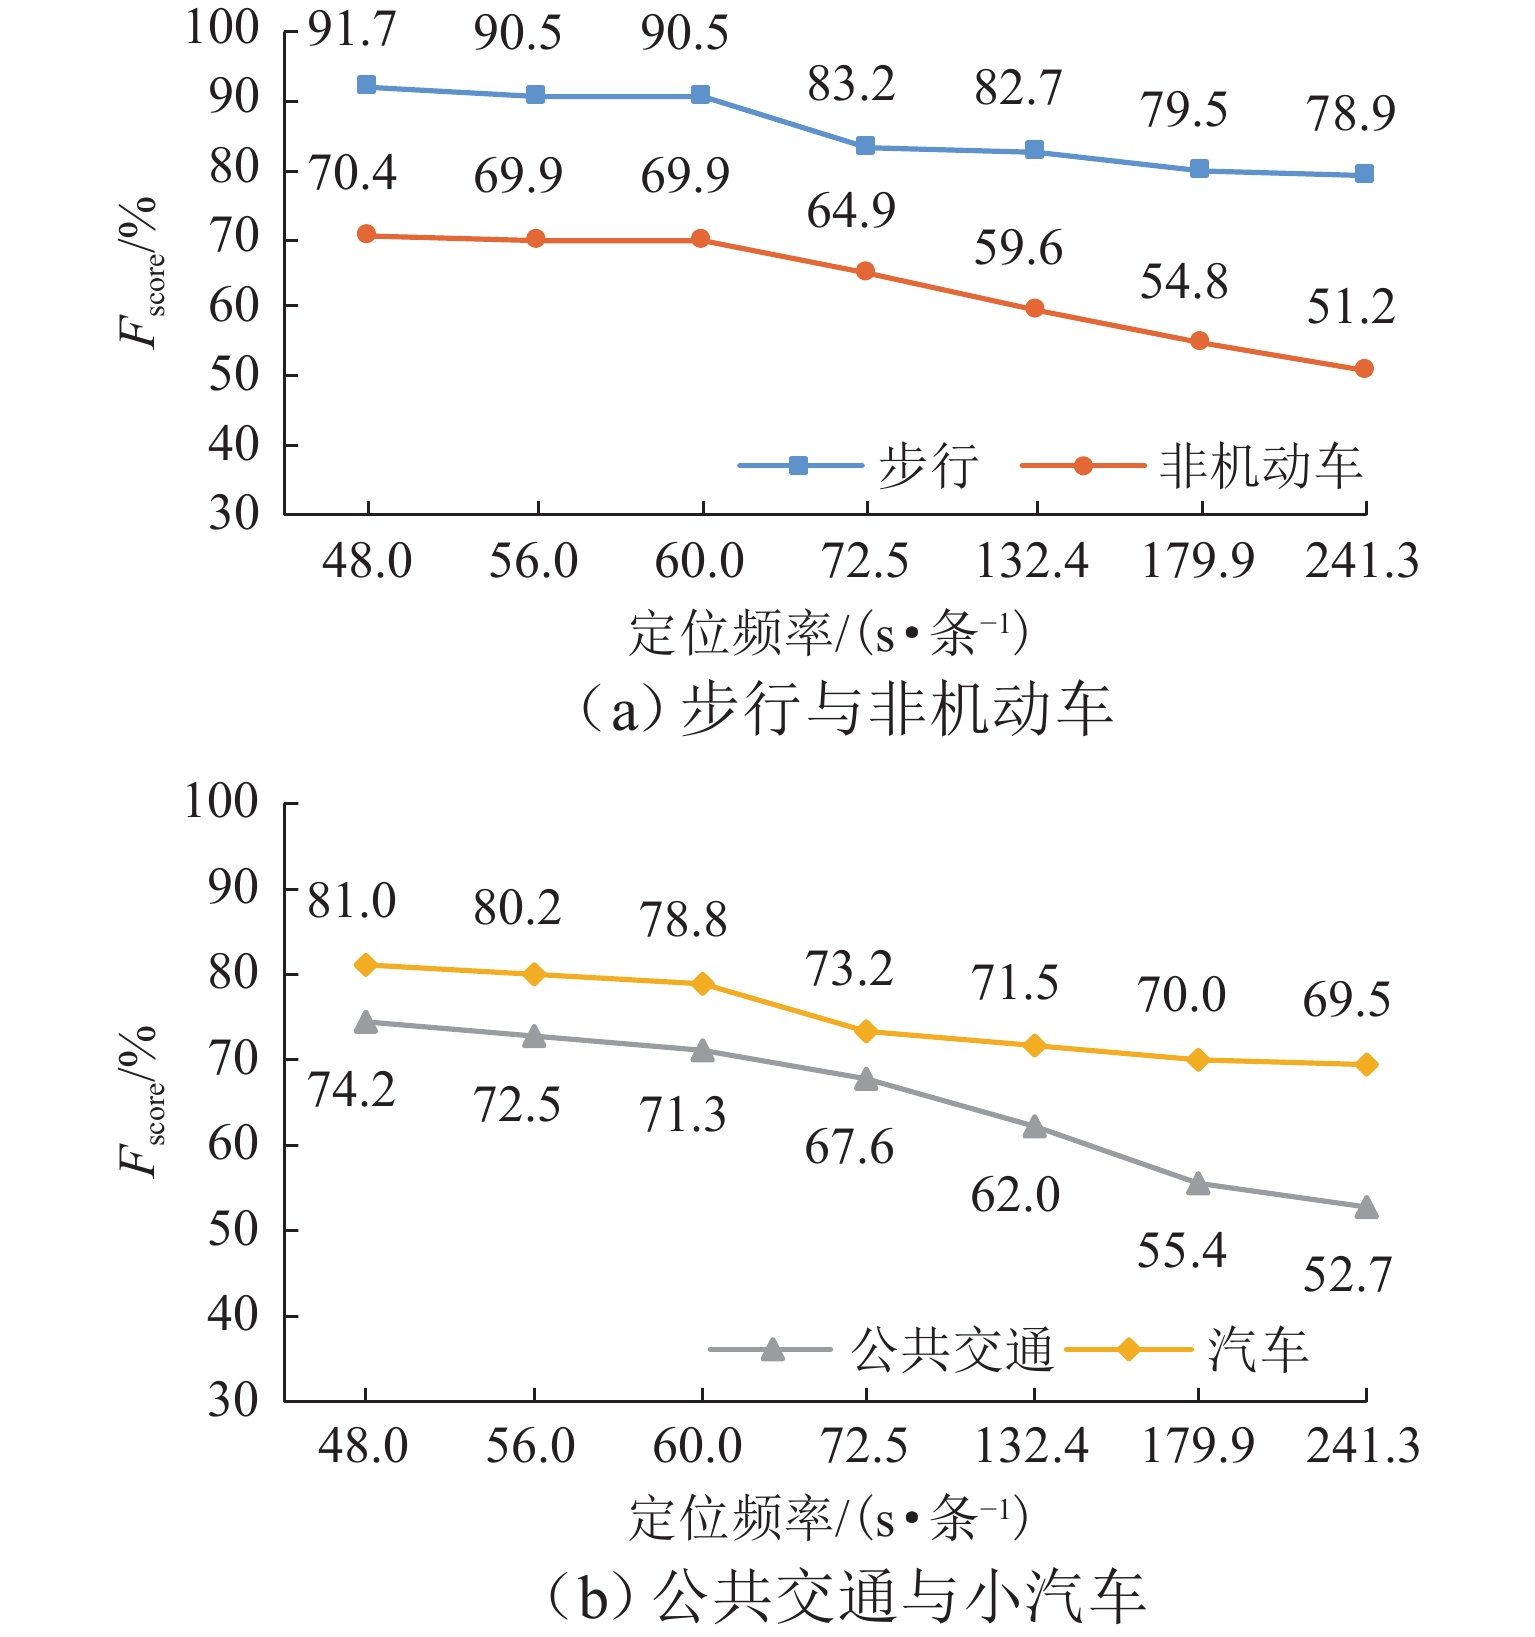
作为影响手机信令数据定位质量的关键因素,定位频率对交通方式的识别精度具有重要影响. 为量化定位频率与交通方式识别精度之间的变化规律,首先,提出一种基于随机森林的交通方式识别模型;其次,在通信运营商的协助下,通过开展实地数据采集实验,完成手机信令数据及对应真实出行信息的同步采集,并利用该数据集对本文提出的交通方式识别模型进行验证;最后,通过数据抽样形成一系列拥有不同定位频率的手机信令数据集,利用该系列数据集对不同定位频率下的交通方式识别精度进行评估研究. 研究结果表明:本文模型对步行、非机动车、汽车和公共交通4种交通方式的总体识别准确率为79.2%;每种交通方式对定位频率的敏感性不同,其中非机动车与公交的敏感性更高,步行和汽车的敏感性相对较低;随着平均定位频率从48 s/条下降至241 s/条,非机动车和公交的整体识别精度下降幅度分别约为19.2%和21.5%,而步行与汽车的整体识别精度则分别下降12.8%与11.5%;综合考虑识别准确率与计算效率两方面的需求,建议将60 s/条作为用户筛选与数据抽样的最佳阈值.
Abstract:As a key factor affecting location quality of cellular phone data, location frequency has an important influence on the extraction accuracy of travel mode. In order to quantify the change rule between the location frequency and accuracy of travel mode extraction, a travel mode extraction model based on random forest is proposed. Second, with the help of communication operators, through a field data collection, individual cellular phone data and corresponding real travel information were simultaneously acquired. The dataset is used to verify the travel mode extraction model. Finally, a series of cellular phone datasets with different location frequencies are built through data sampling. With this series of datasets, the extraction accuracy of traffic modes under different location frequencies is evaluated. The evaluation results show that the overall extraction accuracy for walking, non-motorized vehicles, cars, and buses is 79.2%, and the sensitivity of each travel mode to location frequency is different. The sensitivity of non-motorized vehicles and buses is higher, and the sensitivity of walking and cars is relatively low. As the location frequency is decreased from 48 seconds per data to 241 seconds per data, the overall accuracy of non-motorize vehicles and buses is decreased by 19.2% and 21.5%, respectively, while that of walking and car is decreased by 12.8% and 11.5%, respectively. Owning to the requirements of extraction accuracy and computing efficiency, 60 seconds per data is recommended as the optimal threshold for user screening and data sampling.
-
Key words:
- intelligent traffic /
- travel mode /
- cellular phone data /
- location frequency /
- random forest
-
表 1 手机信令数据样例
Table 1. Samples of cellular phone data
用户全球标识码 设备标识码 位置区编号 基站小区编号 460***340 2185 ***7347 34054 1710732 460***340 2185 ***7347 34054 1710732 460***340 2185 ***7347 34054 1678945 日期 时刻 基站经度/(°) 基站纬度/(°) 2019-9-21 9:00:34 106.6992 26.58389 2019-9-21 9:01:41 106.7025 26.58639 2019-9-21 9:02:10 106.7025 26.58639 表 2 本研究使用的出行数据集构成
Table 2. Composition of dataset of interest
交通方式 数据量/条 出行段量/个 步行 12412 114 非机动车 9534 77 汽车 23655 207 公共交通 23458 186 合计 69059 584 表 3 特征参数的重要度排名
Table 3. Characteristic parameters ranking in terms of importance
变量 变量意义 重要度/% f 基站使用频率 10.02 Z11 11 min 时间窗直线距离 8.45 Ttotal 出行总时间 7.92 DOD 出行 OD 距离 7.30 Z9 9 min 时间窗直线距离 7.26 VaveOD OD 间平均速度 6.96 n 基站使用个数 6.36 Z7 7 min 时间窗直线距离 5.23 Z5 5 min 时间窗直线距离 5.16 $ V_{\mathrm{ave}Z_{11}} $ 11 min 时间窗直线平均速度 4.04 $ V_{\mathrm{ave}Z_9} $ 9 min 时间窗直线平均速度 3.54 $ V_{\mathrm{ave}Z_7} $ 7 min 时间窗直线平均速度 3.51 $ V_{\mathrm{ave}Z_5} $ 5 min 时间窗直线平均速度 2.98 L11 11 min 时间窗累积距离 2.97 L9 9 min 时间窗累积距离 2.54 $ V_{\mathrm{ave}L_{11}} $ 11 min 时间窗累积平均速度 2.44 $ V_{\mathrm{ave}L_9} $ 9 min 时间窗累积平均速度 2.40 L7 7 min 时间窗累积距离 2.28 $ V_{\mathrm{ave}L_7} $ 7 min 时间窗累积平均速度 2.08 L5 5 min 时间窗累积距离 1.71 $ V_{\mathrm{ave}L_5} $ 5 min 时间窗累积平均速度 1.50 Tb 相邻数据的时间差 1.26 Db 相邻数据的基站切换距离 1.10 Vb 相邻数据的基站切换速度 1.02 表 4 机器学习算法主要参数
Table 4. Main parameters in machine learning algorithms
算法 参数设置 参数值 支持向量机 核函数 径向基函数 核参数 σ 0.25 惩罚系数 $ \tau $ 1 BP 神经网络 神经元层数/层 2 神经元个数/个 (100,50) 隐藏层激活函数 Relu 权重优化算法 Sgd 初始学习率 0.05 表 5 测试集识别结果
Table 5. Recognition results of test dataset
交通方式 出行段数量/个 识别结果/个 步行 非机动 公交车 汽车 步行 37 33 1 2 1 非机动车 24 2 19 3 0 公共交通 65 0 8 46 10 汽车 58 0 2 9 47 合计 184 35 30 60 58 表 6 评价指标统计结果
Table 6. Statistical results of evaluation indicators
交通方式 出行段数量/个 P/% R/% Fscore/% 步行 37 94.3 89.2 91.7 非机动车 24 63.3 79.2 70.4 公共交通 65 76.7 71.9 74.2 汽车 58 81.0 81.0 81.0 合计 184 79.2 79.2 79.2 -
[1] 杨飞,姚振兴. 基于手机定位数据的个体出行行为特征分析与技术研究:方法与实证[M]. 上海: 同济大学出版社,2017:2-4. [2] 张博. 基于手机网络定位的OD调查的出行方式划分研究[D]. 北京: 北京交通大学,2010. [3] QU Y C, GONG H, WANG P. Transportation mode split with mobile phone data[C]//2015 IEEE 18th International Conference on Intelligent Transportation Systems. Gran Canaria: IEEE, 2015: 285-289. [4] LARIJANI A N, OLTEANU-RAIMOND A M, PERRET J, et al. Investigating the mobile phone data to estimate the origin destination flow and analysis; case study: Paris region[J]. Transportation Research Procedia, 2015, 6: 64-78. doi: 10.1016/j.trpro.2015.03.006 [5] ASGARI F. Inferring user multimodal trajectories from cellular network metadata in metropolitan areas[D]. Paris: University of Pierre & Marie Curie, 2016. [6] POONAWALA H, KOLAR V, BLANDIN S, et al. Singapore in motion: insights on public transport service level through farecard and mobile data analytics[C]//Proceedings of the 22nd ACM SIGKDD International Conference on Knowledge Discovery and Data Mining. San Francisco: ACM, 2016: 589-598. [7] DANAFAR S, PIORKOWSKI M, KRYSCZCUK K. Bayesian framework for mobility pattern discovery using mobile network events[C]//2017 25th European Signal Processing Conference (EUSIPCO). Kos: IEEE, 2017: 1070-1074. [8] 钟舒琦,邓如丰,邓红平,等. 基于兴趣点与导航数据的手机信令数据出行方式识别[J]. 中山大学学报(自然科学版),2020,59(3): 87-96.ZHONG Shuqi, DENG Rufeng, DENG Hongping, et al. Recognition of traffic mode of mobile phone data based on the combination of point of interest data and navigation data[J]. Acta Scientiarum Naturalium Universitatis Sunyatseni, 2020, 59(3): 87-96. [9] HUANG H S, CHENG Y, WEIBEL R. Transport mode detection based on mobile phone network data: a systematic review[J]. Transportation Research Part C: Emerging Technologies, 2019, 101: 297-312. doi: 10.1016/j.trc.2019.02.008 [10] BURKHARD O, BECKER H, WEIBEL R, et al. On the requirements on spatial accuracy and sampling rate for transport mode detection in view of a shift to passive signalling data[J]. Transportation Research Part C: Emerging Technologies, 2020, 114: 99-117. doi: 10.1016/j.trc.2020.01.021 [11] YANG F, WANG Y C, JIN P J, et al. Random forest model for trip end identification using cellular phone and points of interest data[J]. Transportation Research Record: Journal of the Transportation Research Board, 2021, 2675(7): 454-466. doi: 10.1177/03611981211031537 [12] 宋璐. 基于手机定位数据的交通OD分布研究[D]. 南京: 东南大学,2015. [13] 钟罡. 基于手机大数据的城市综合客运枢纽乘客出行行为分析方法研究[D]. 南京: 东南大学,2019. [14] 陈晓光. 基于手机信令数据的出行端点识别误差与交通小区划分尺度研究[D]. 成都: 西南交通大学,2020. [15] Breiman L. Random forest[J]. Machine Learning, 2001, 45(1): 5-32. doi: 10.1023/A:1010933404324 [16] CHENG L, CHEN X W, DE VOS J, et al. Applying a random forest method approach to model travel mode choice behavior[J]. Travel Behaviour and Society, 2019, 14: 1-10. doi: 10.1016/j.tbs.2018.09.002 -


 下载:
下载:
