

Trajectory Reconstruction for Traffic Flow Mixed withConnected Automated Vehicles Based on Car-Following Characteristics
-
摘要:
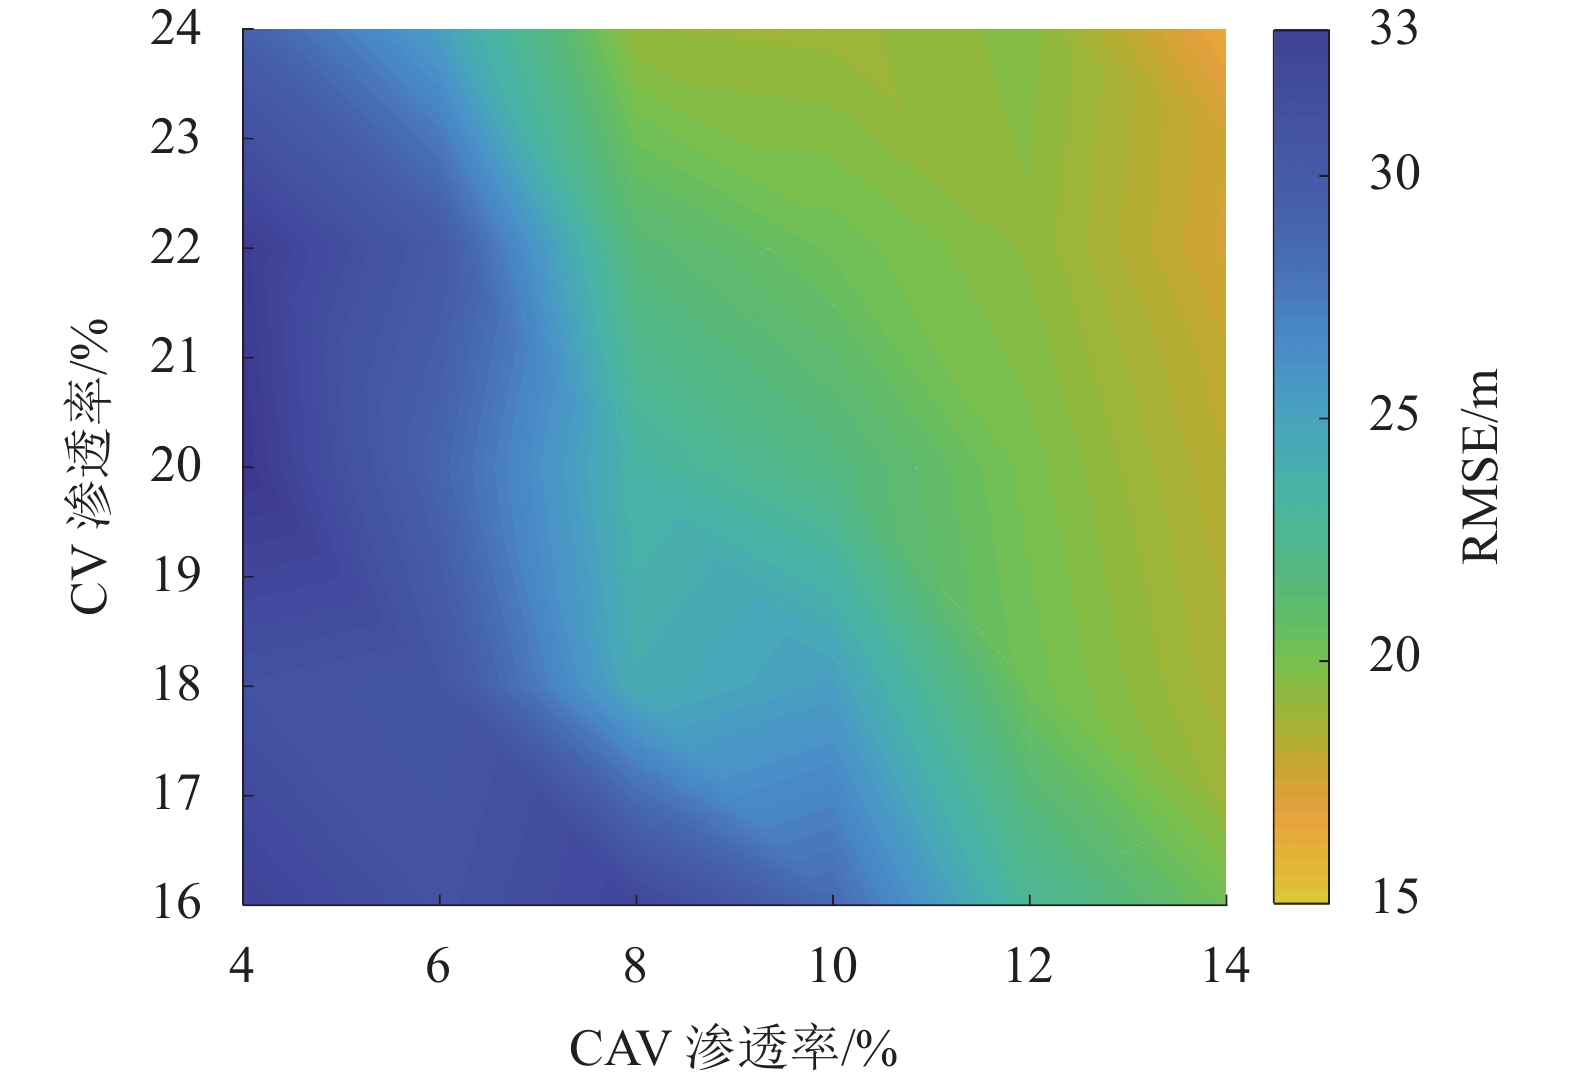
车辆轨迹数据蕴含着丰富的时空交通信息,是交通状态估计的基础数据之一. 为解决现有数据采集环境难以获得全样本车辆轨迹的问题,面向智能网联环境,构建了混合交通流全样本车辆轨迹重构模型. 首先,分析了智能网联环境下混合交通流的车辆构成及其轨迹数据采集环境;然后,提出了基于智能驾驶员跟驰模型的车辆轨迹重构模型,实现了对插入轨迹数量、轨迹位置和速度等参数的估计;最后,设计仿真试验验证了模型在不同交通流密度和智能网联车(connected automated vehicle,CAV)渗透率条件下的适用性. 试验结果表明:CAV和网联人工驾驶车(connected vehicle,CV)的渗透率为8%和20%时,该车辆轨迹重构模型在不同交通流密度下均能重构84%以上的车辆轨迹;重构轨迹准确性随着CAV和CV渗透率的增加而提高;当交通密度为70辆/km,且CAV渗透率仅为4%的情况下,模型也能重构82%的车辆轨迹.
Abstract:Vehicle trajectory data contains massive spatial-temporal traffic information, which is one of the necessary data for traffic state estimation. To solve the problem that it's difficult to obtain the fully sampled vehicular trajectory in the existing data collection environment, oriented to the connected and automated environment, a fully sampled trajectory reconstruction model of mixed traffic flow is proposed . Firstly, vehicle composition and trajectory data collection environment of mixed traffic flow with the connected automated vehicle (CAV) are analyzed. Then, a vehicle trajectory reconstruction model is proposed based on intelligent driver car-following model. Based on this, the number of inserted trajectories, trajectory position and speed are estimated. Finally, numerical simulation is designed to investigate the influence of traffic density and penetration rate of CAVs. Results show that, when the penetration rates of CAV and connected vehicle (CV) at 8% and 20%, respectively, the model can reconstruct more than 84% vehicular trajectories under different traffic densities. The accuracy of the reconstructed trajectories increases with the increase in penetration rates of CAV and CV. Besides, when the traffic density is 70 veh/km and the penetration rate of CAV at a low level of 4%, the proposed model can reconstruct 82% vehicular trajectories.
-
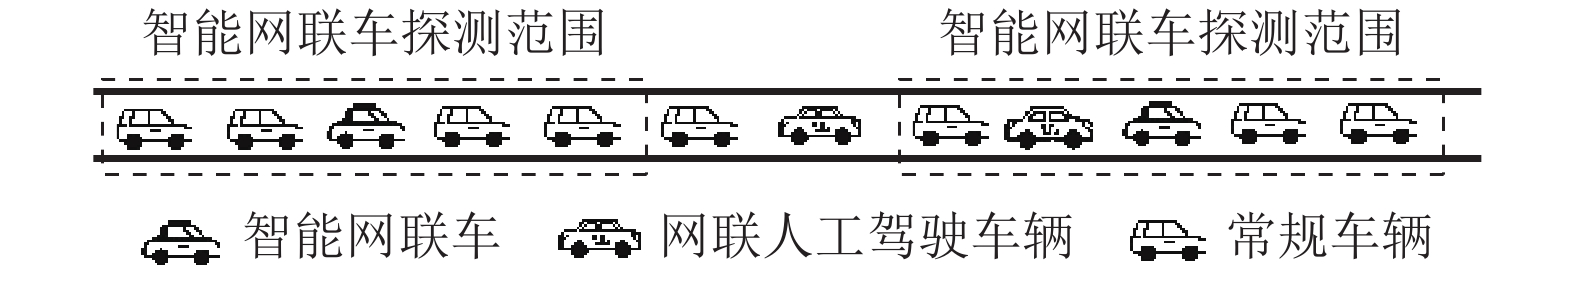
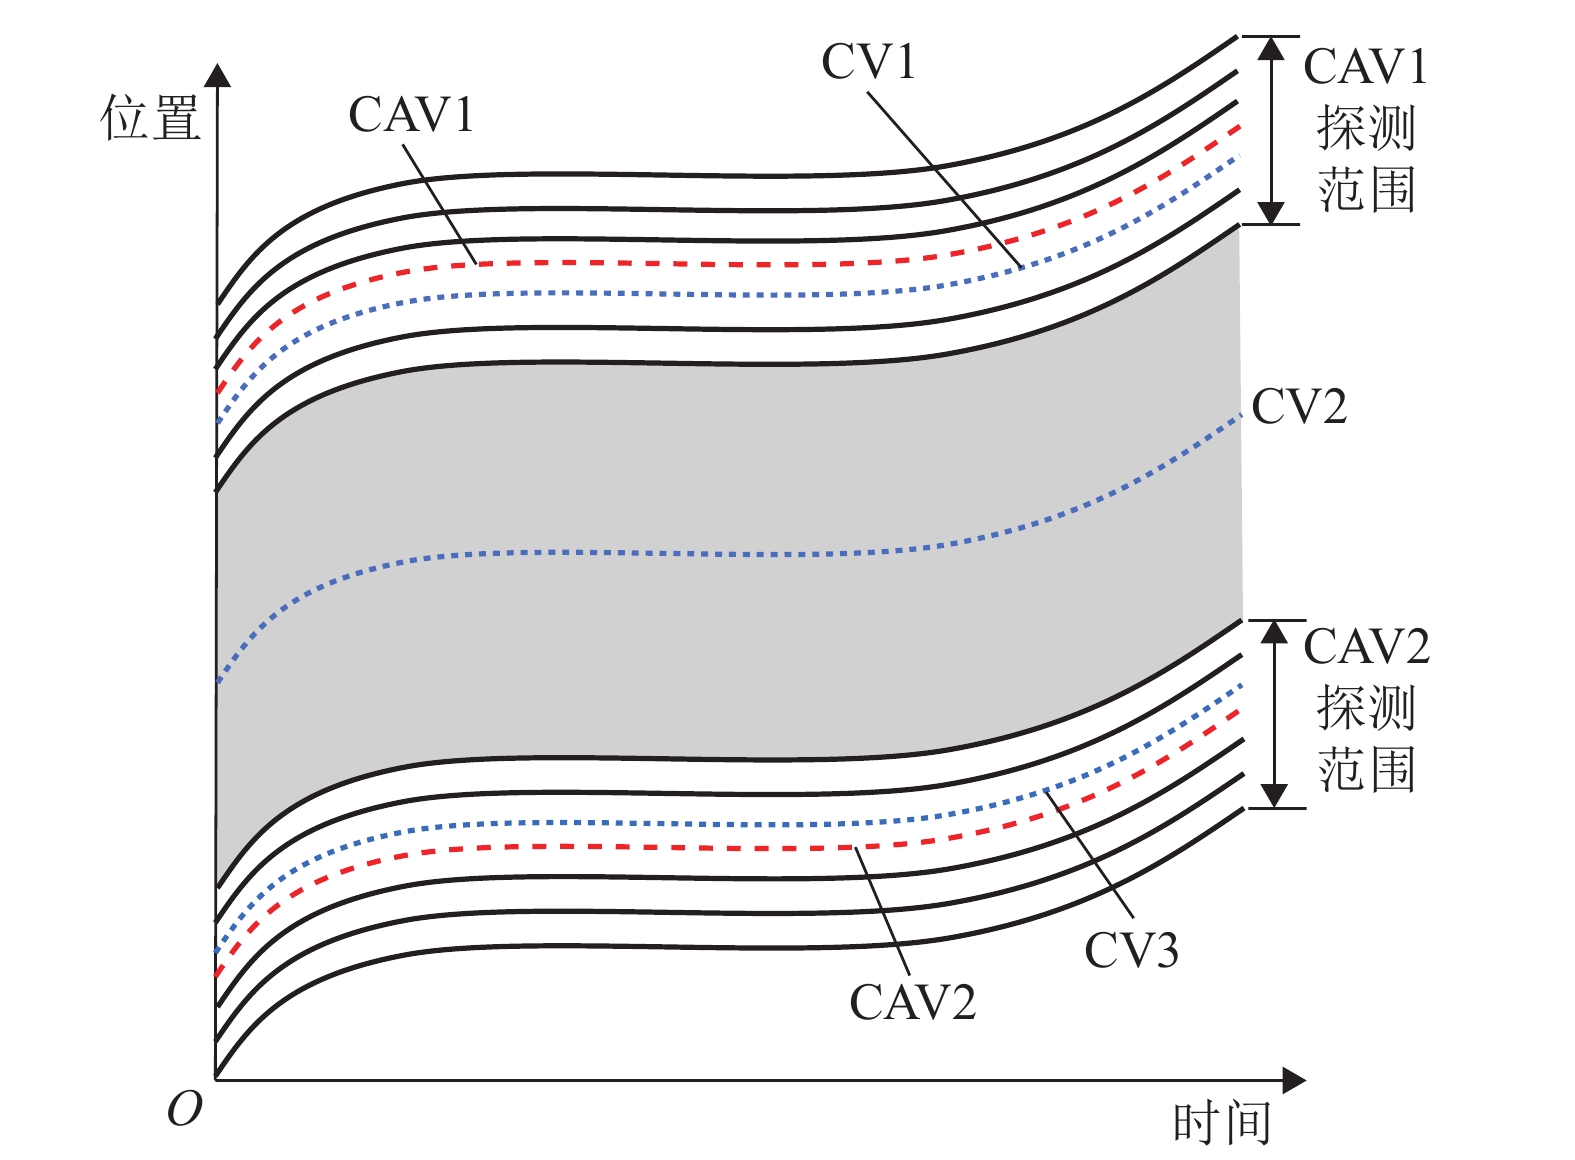
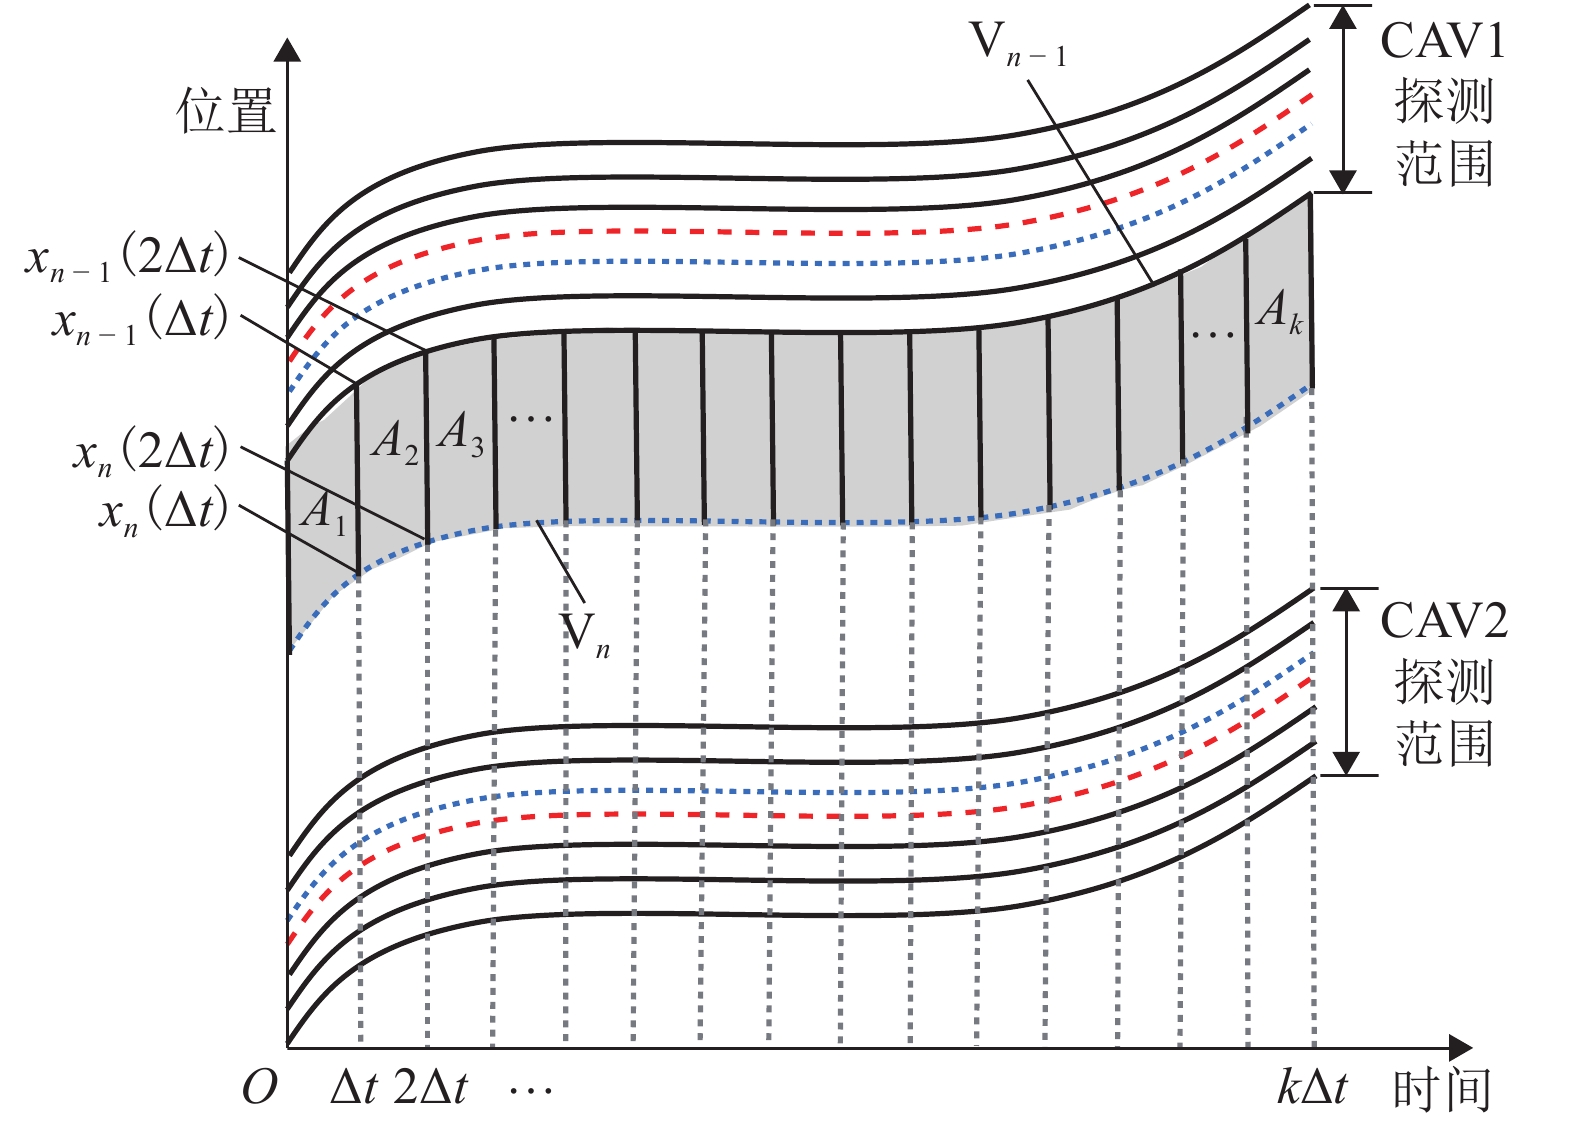
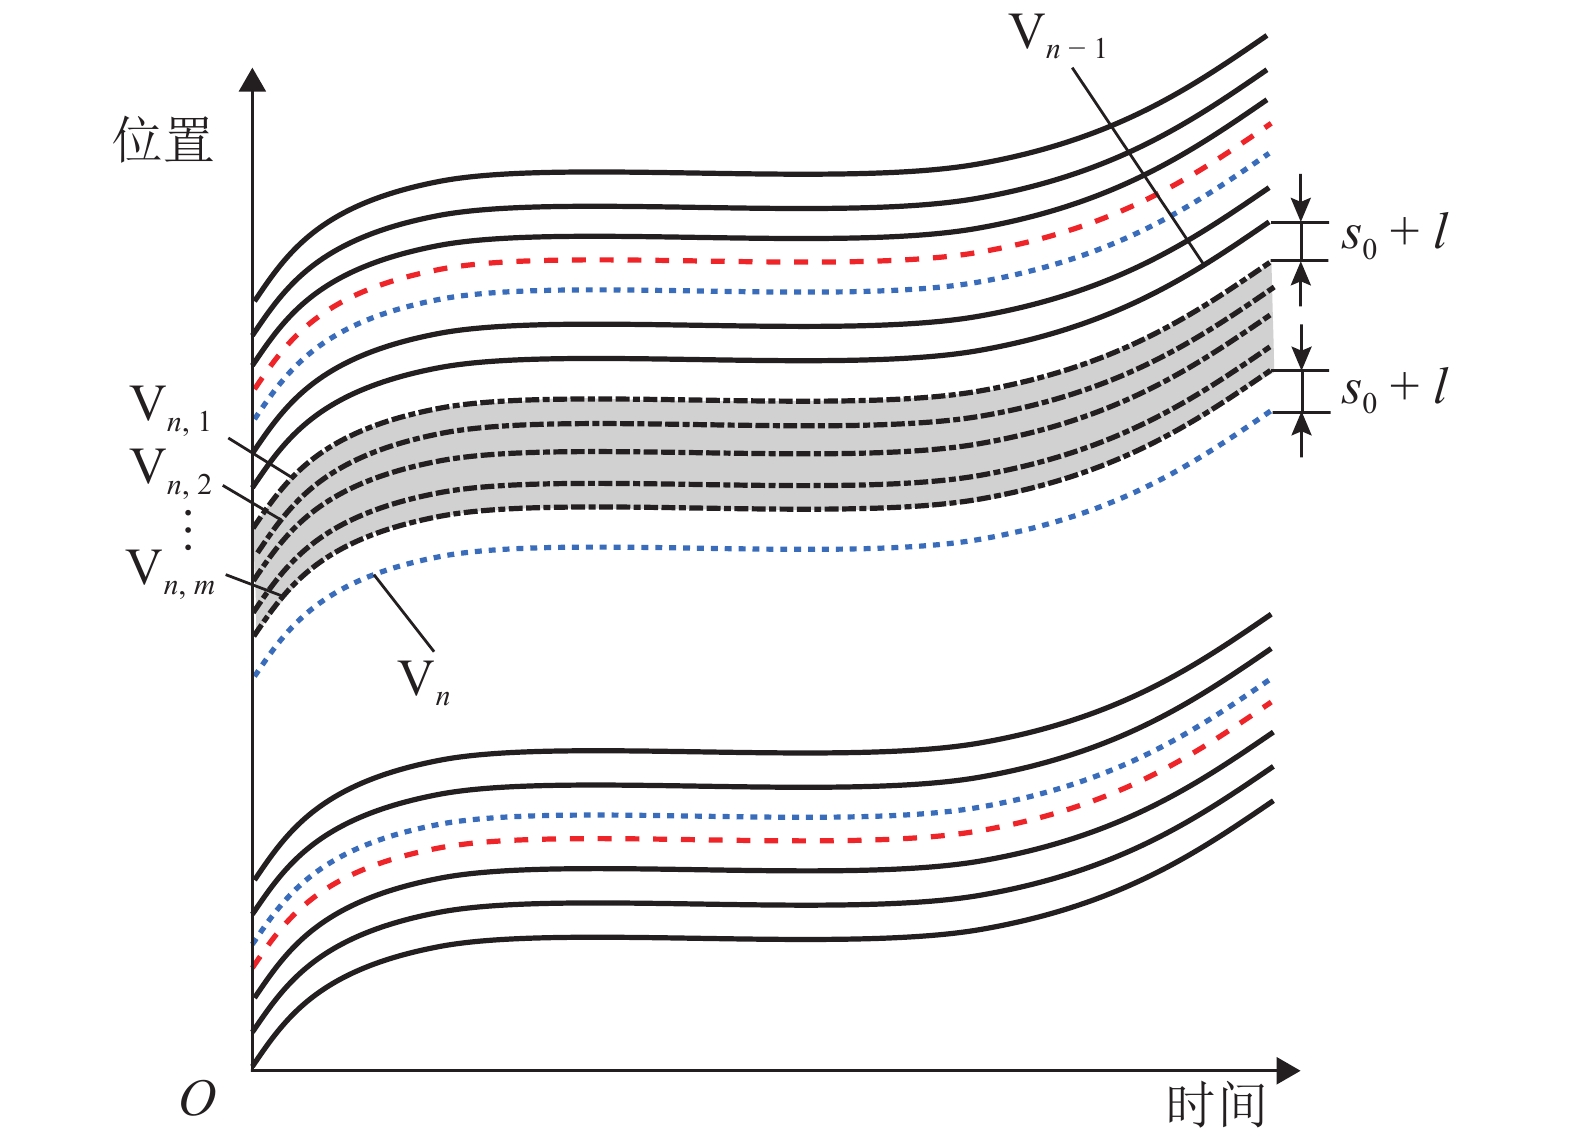
图 1 混合交通流中不同车辆组成
Figure 1. Composition of different types of vehicles in mixed traffic flow
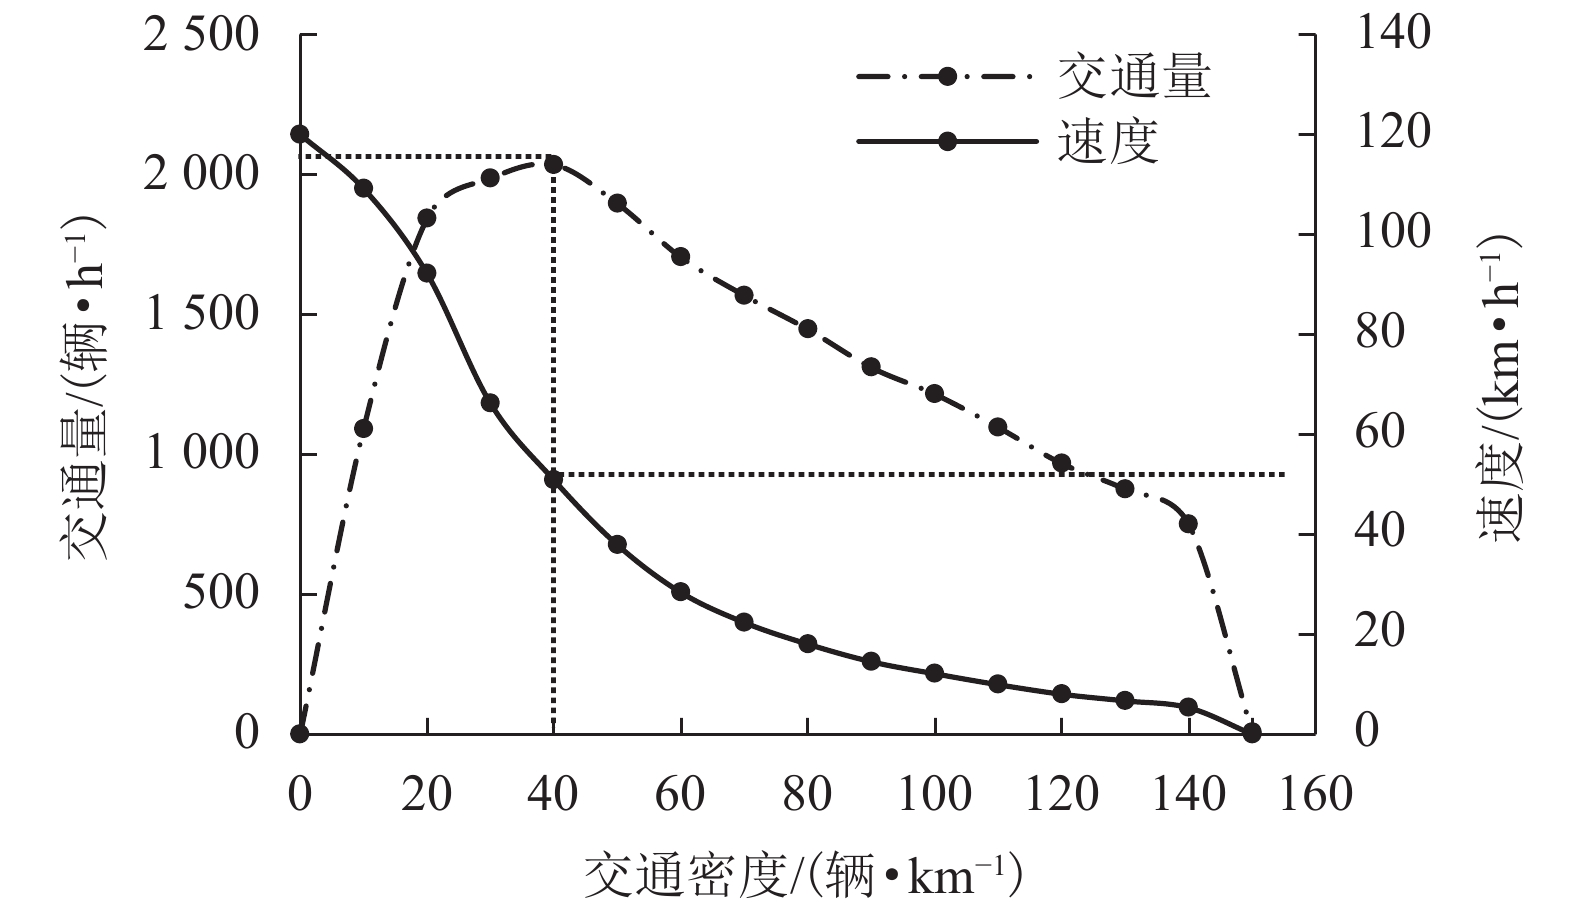
图 5 流量-密度-速度关系
Figure 5. Relationship between volume,density and speed of traffic flow
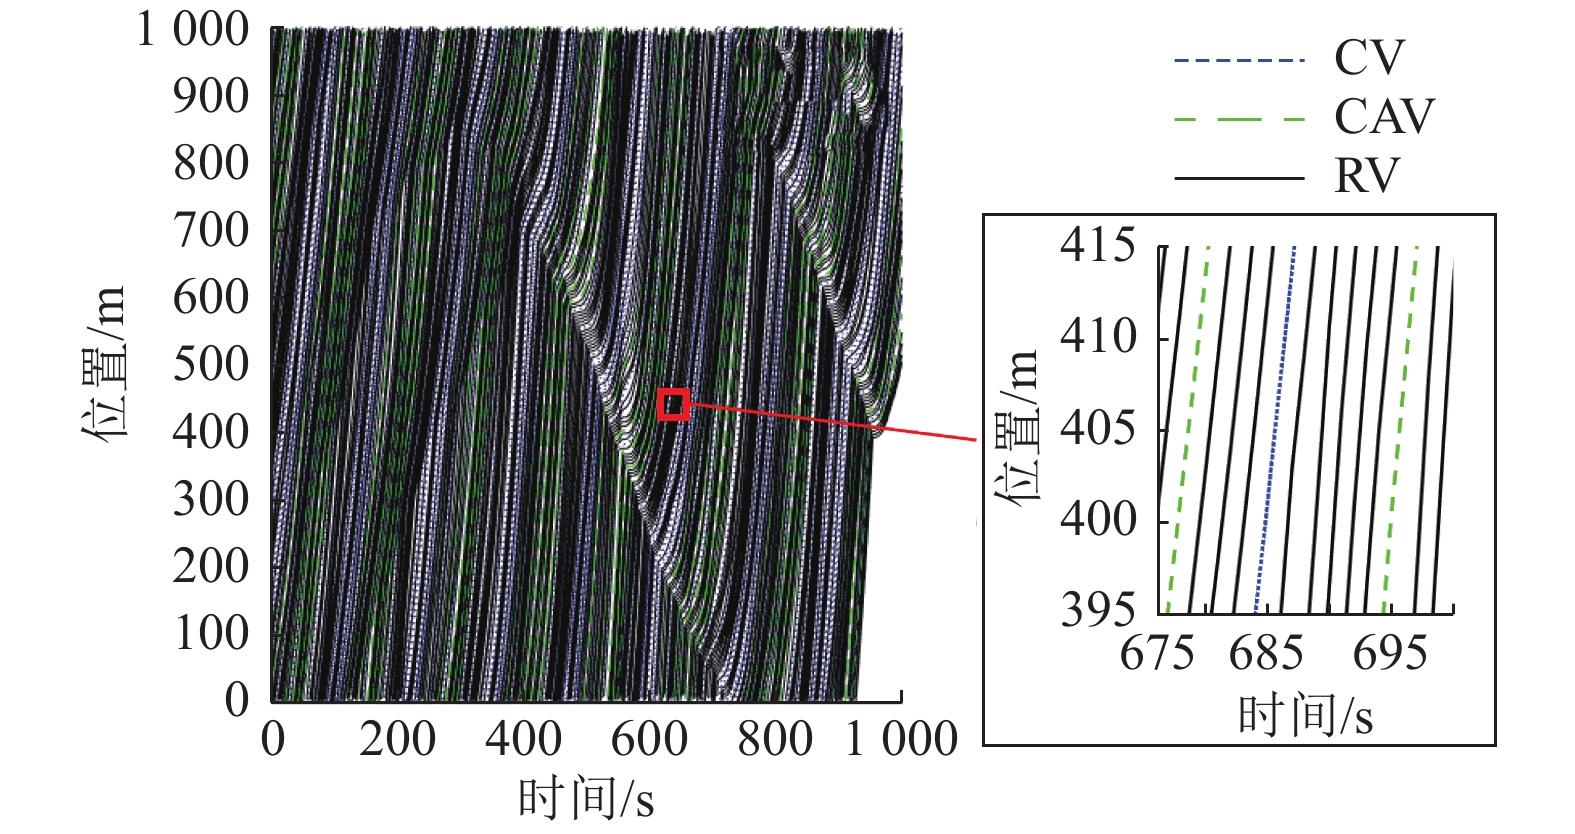
图 6 交通流密度为60辆/km时轨迹时空图
Figure 6. Spatio-temporal diagram of the trajectories when traffic flow density is 60 veh/km
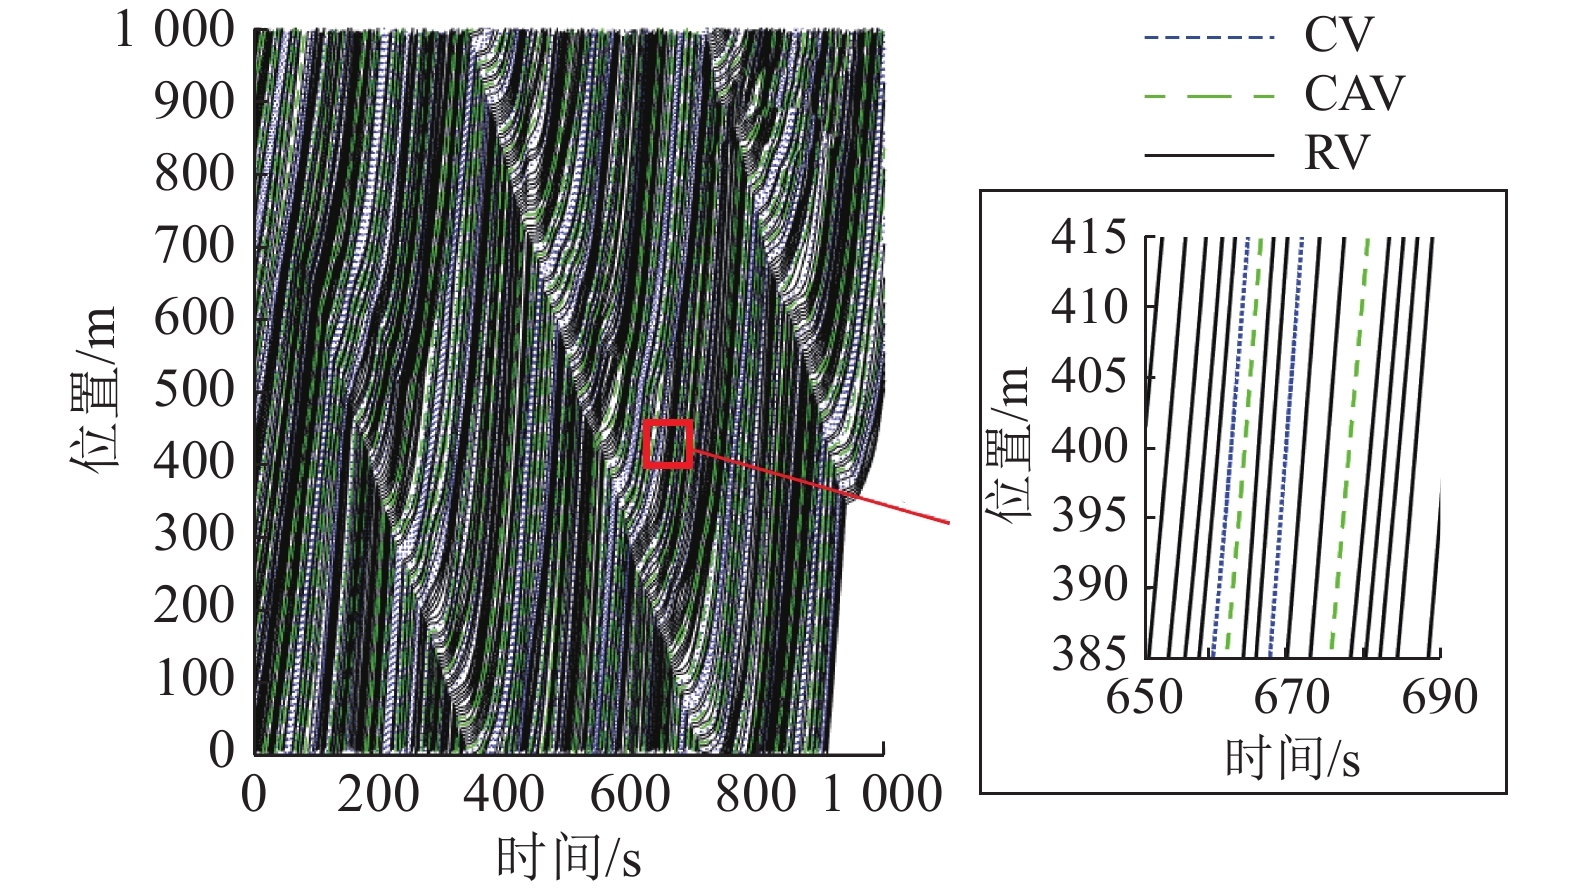
图 7 CAV渗透率为14%时轨迹时空图
Figure 7. Spatio-temporal diagram of the trajectories when CAV penetration rate is 14%
表 1 不同交通流密度条件下插入车辆数估计
Table 1. Estimation of the numbers of inserted vehicles under different traffic densities
交通流密度/
(辆•km−1)CAV/
辆插入车辆/辆 实际车辆/辆 插入误差/辆 插入误差百分比/% 20 2 5.80 6.40 0.60 9.38 30 2 14.05 13.80 0.35 2.54 40 3 15.80 16.05 0.25 1.56 50 4 21.75 21.38 0.31 1.50 60 5 27.85 25.75 2.10 8.16 70 6 31.40 27.25 4.30 15.78 注:表中插入车辆数为多次仿真试验的平均值,因此会出现不是整数的情况;插入误差百分比为插入辆数的误差与实际插入车辆数的百分比.  下载: 导出CSV
表 2 不同交通流密度条件下轨迹重构误差
Table 2. Trajectory reconstruction error under different traffic density conditions
交通流密度/
(辆•km−1)CAV/
辆MAE/
mMAPE/
%RMSE/
m20 2 15.02 0.36 18.28 30 2 11.90 0.29 14.30 40 3 12.14 0.31 18.68 50 4 12.30 0.35 20.39 60 5 13.09 0.42 22.19 70 6 13.39 0.52 23.47 平均值 12.97 0.37 19.55
下载: 导出CSV
表 3 不同渗透率条件下插入车辆数估计
Table 3. Estimation of the numbers of inserted vehicles under different CAV penetration rates
CAV
渗透率/%CAV/辆 插入
车辆/辆实际
车辆/辆插入
误差/辆插入误差
百分比/%4 3 45.50 38.70 6.80 17.57 6 4 41.50 35.20 5.80 16.48 8 6 31.40 27.25 4.30 15.78 10 7 29.44 25.44 4.00 15.72 12 8 26.80 23.20 3.60 15.52 14 10 19.60 17.00 2.60 15.29
下载: 导出CSV
表 4 CAV不同渗透率条件下轨迹重构误差
Table 4. Trajectory reconstruction error under different CAV penetration rates
CAV渗
透率/%CAV/辆 MAE/m MAPE/% RMSE/m 4 3 16.76 0.68 33.77 6 4 15.69 0.63 28.95 8 6 13.39 0.52 23.47 10 7 12.98 0.51 21.86 12 8 12.23 0.49 19.90 14 10 10.45 0.42 16.45
下载: 导出CSV
表 5 CV不同渗透率轨迹重构结果
Table 5. Reconstruction results of different CV penetration rates
CV 渗透率/% CV/辆 插入
误差/辆插入误差
百分比/%MAE/m MAPE/
%RMSE/
m16 11 5.40 0.18 17.46 0.69 32.43 18 13 4.33 0.16 13.98 0.55 24.27 20 14 4.30 0.16 13.39 0.52 23.47 22 15 4.20 0.15 12.93 0.52 21.50 24 17 3.80 0.14 11.50 0.48 19.11
下载: 导出CSV
-
[1] BANSAL P, KOCKELMAN K M. Forecasting Americans’ long-term adoption of connected and autonomous vehicle technologies[J]. Transportation Research Part A:Policy and Practice, 2017, 95: 49-63. doi: 10.1016/j.tra.2016.10.013 [2] PUNZO V, BORZACCHIELLO M T, CIUFFO B. On the assessment of vehicle trajectory data accuracy and application to the Next Generation SIMulation (NGSIM) program data[J]. Transportation Research Part C:Emerging Technologies, 2011, 19(6): 1243-1262. doi: 10.1016/j.trc.2010.12.007 [3] COIFMAN B. Estimating travel times and vehicle trajectories on freeways using dual loop detectors[J]. Transportation Research Part A:Policy and Practice, 2002, 36(4): 351-364. doi: 10.1016/S0965-8564(01)00007-6 [4] RAO W M, WU Y J, XIA J X, et al. Origin-destination pattern estimation based on trajectory reconstruction using automatic license plate recognition data[J]. Transportation Research Part C:Emerging Technologies, 2018, 95: 29-46. doi: 10.1016/j.trc.2018.07.002 [5] HAO P, BORIBOONSOMSIN K, WU G Y, et al. Modal activity-based stochastic model for estimating vehicle trajectories from sparse mobile sensor data[J]. IEEE Transactions on Intelligent Transportation Systems, 2017, 18(3): 701-711. doi: 10.1109/TITS.2016.2584388 [6] WAN N F, VAHIDI A, LUCKOW A. Reconstructing maximum likelihood trajectory of probe vehicles between sparse updates[J]. Transportation Research Part C:Emerging Technologies, 2016, 65: 16-30. doi: 10.1016/j.trc.2016.01.010 [7] SHAN X N, HAO P, CHEN X H, et al. Vehicle energy/emissions estimation based on vehicle trajectory reconstruction using sparse mobile sensor data[J]. IEEE Transactions on Intelligent Transportation Systems, 2019, 20(2): 716-726. doi: 10.1109/TITS.2018.2826571 [8] LI Z, KLUGER R, HU X B, et al. Reconstructing vehicle trajectories to support travel time estimation[J]. Transportation Research Record:Journal of the Transportation Research Board, 2018, 2672(42): 148-158. doi: 10.1177/0361198118772956 [9] XIE X, VAN LINT H, VERBRAECK A. A generic data assimilation framework for vehicle trajectory reconstruction on signalized urban arterials using particle filters[J]. Transportation Research Part C:Emerging Technologies, 2018, 92: 364-391. doi: 10.1016/j.trc.2018.05.009 [10] MEHRAN B, KUWAHARA M, NAZNIN F. Implementing kinematic wave theory to reconstruct vehicle trajectories from fixed and probe sensor data[J]. Transportation Research Part C:Emerging Technologies, 2012, 20(1): 144-163. doi: 10.1016/j.trc.2011.05.006 [11] 唐克双,徐天祥,潘昂,等. 基于定点检测数据的城市干道车辆轨迹重构[J]. 同济大学学报(自然科学版),2016,44(10): 1545-1552.TANG Keshuang, XU Tianxiang, PAN Ang, et al. Signal timing and detector data-based reconstruction of vehicle trajectories on urban arterials[J]. Journal of Tongji University (Natural Science), 2016, 44(10): 1545-1552. [12] 王昊, 金诚杰. 交通流理论及应用[M]. 北京: 人民交通出版社, 2020: 50-79. [13] WANG Y P, WEI L, CHEN P. Trajectory reconstruction for freeway traffic mixed with human-driven vehicles and connected and automated vehicles[J]. Transportation Research Part C: Emerging Technologies, 2020, 111: 135-155. doi: 10.1016/j.trc.2019.12.002 [14] TALEBPOUR A, MAHMASSANI H S. Influence of connected and autonomous vehicles on traffic flow stability and throughput[J]. Transportation Research Part C: Emerging Technologies, 2016, 71: 143-163. doi: 10.1016/j.trc.2016.07.007 [15] YAO Z H, XU T R, JIANG Y S, et al. Linear stability analysis of heterogeneous traffic flow considering degradations of connected automated vehicles and reaction time[J]. Physica A:Statistical Mechanics and Its Applications, 2021, 561: 125218.1-125218.15. doi: 10.1016/j.physa.2020.125218 [16] MILANÉS V, SHLADOVER S E. Modeling cooperative and autonomous adaptive cruise control dynamic responses using experimental data[J]. Transportation Research Part C:Emerging Technologies, 2014, 48: 285-300. doi: 10.1016/j.trc.2014.09.001 -

 下载:
下载:

 点击查看大图
计量
- 文章访问数: 1234
- HTML全文浏览量: 567
- PDF下载量: 67
- 被引次数: 0