Vibration Evaluation and Reliability Analysis of High-Speed Train Transmission System Based on Kernel Density Estimator and Markov Model
-
摘要:
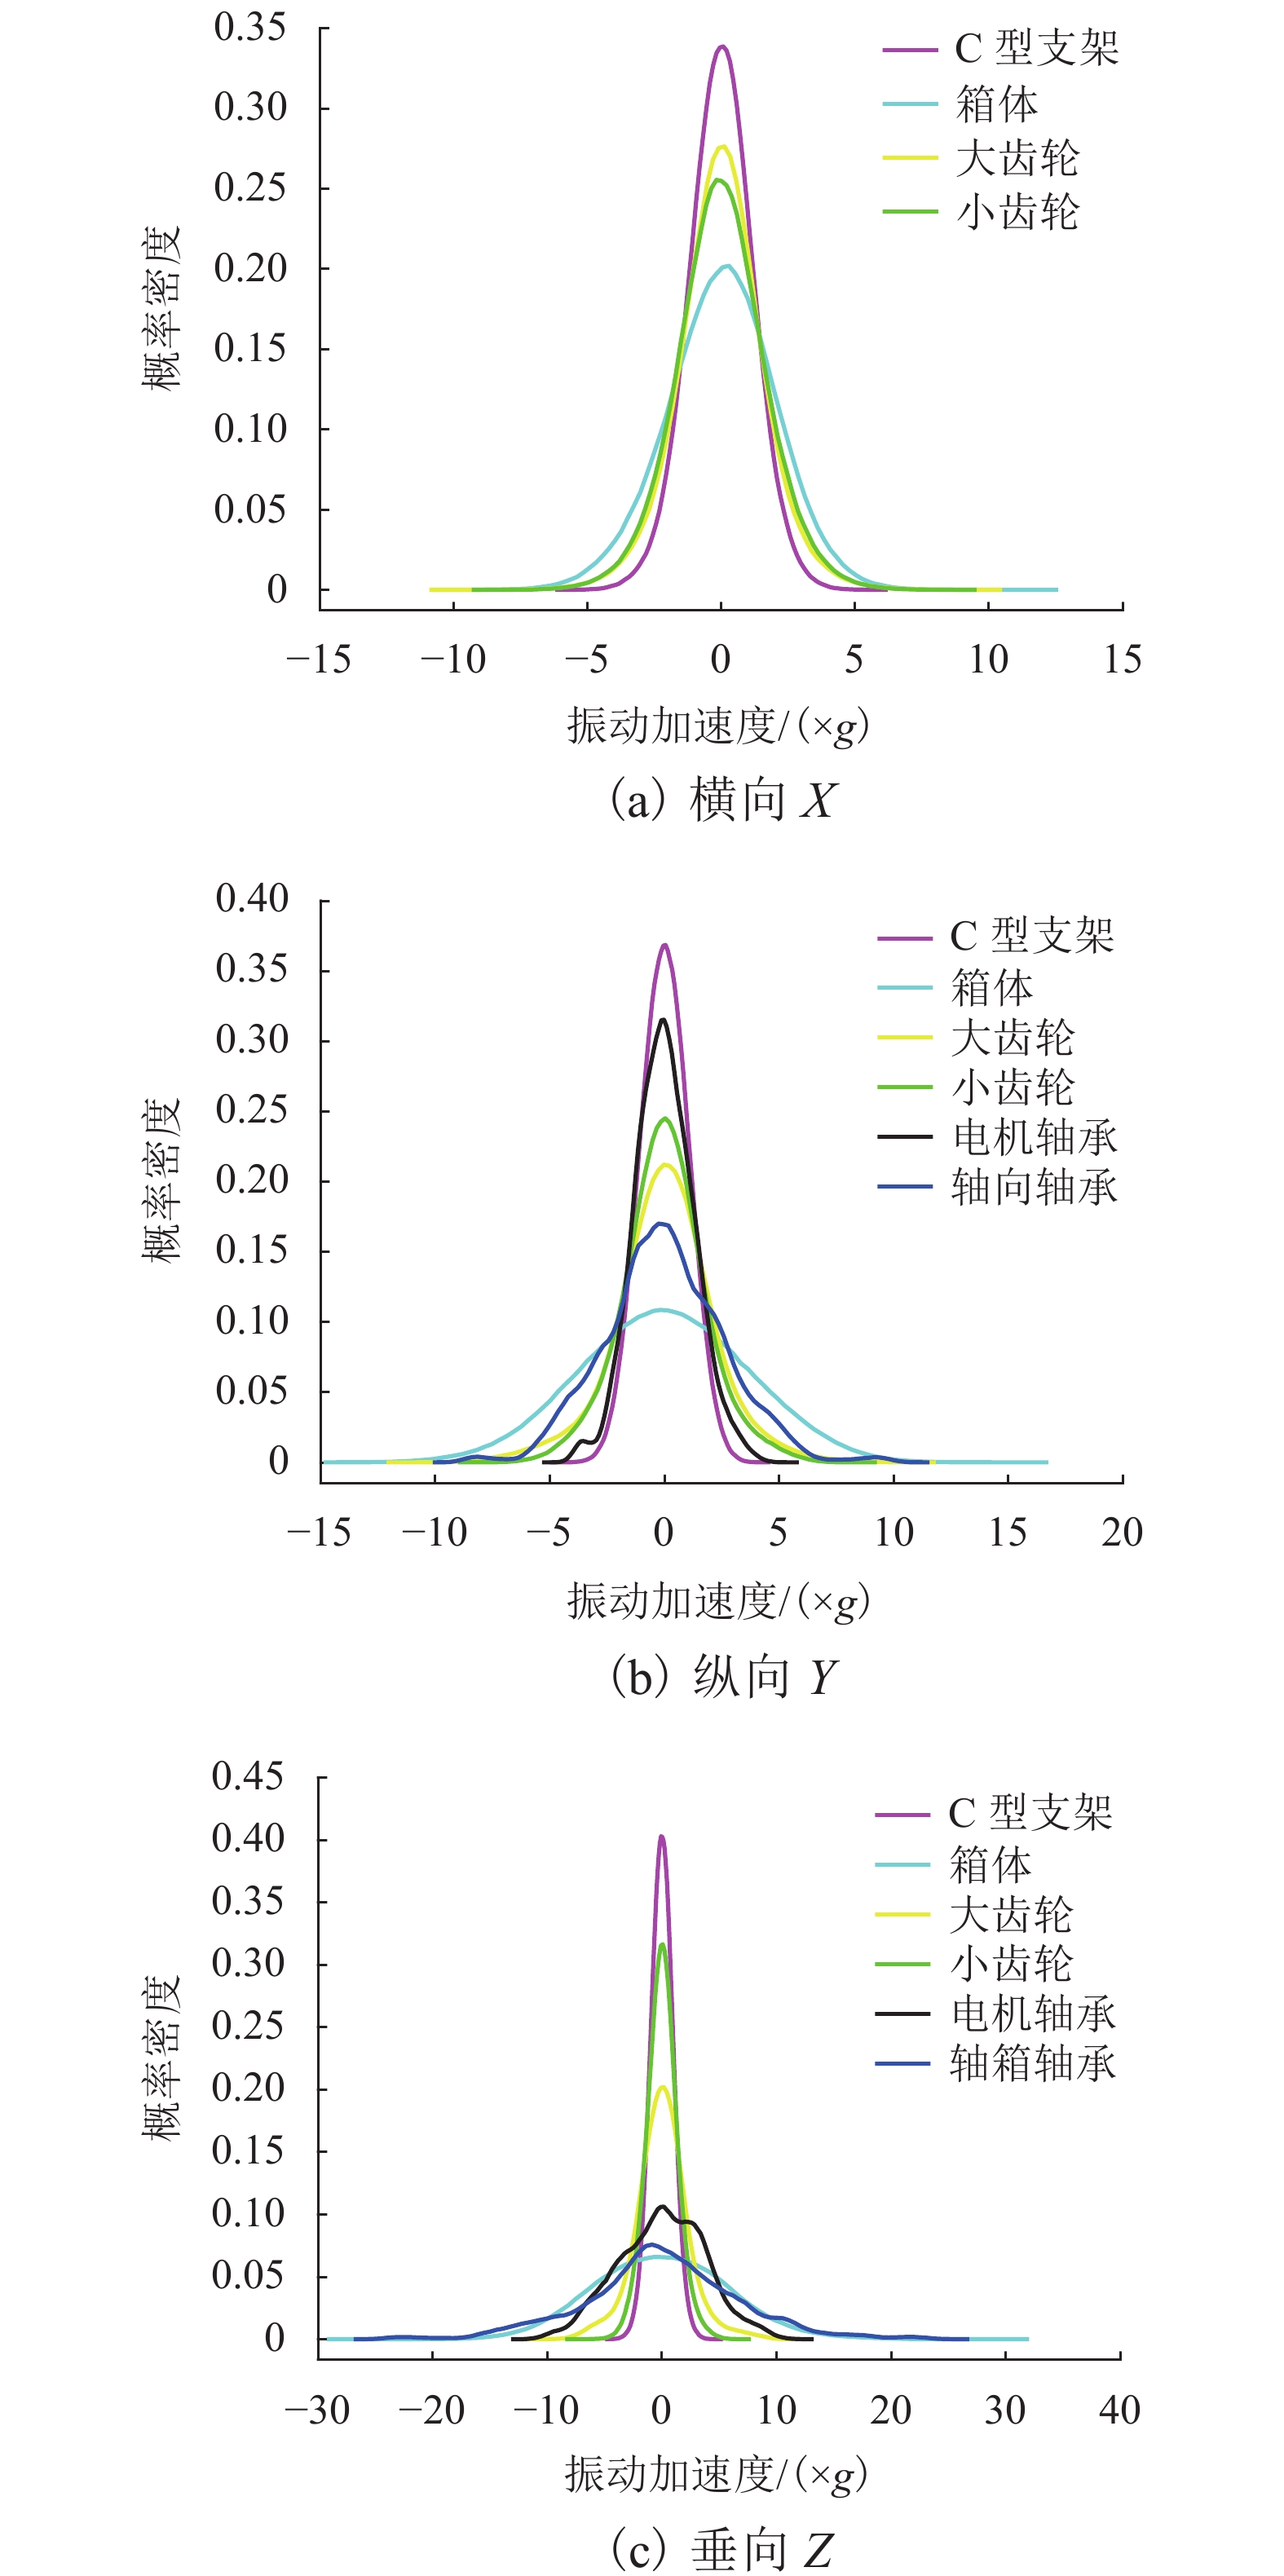
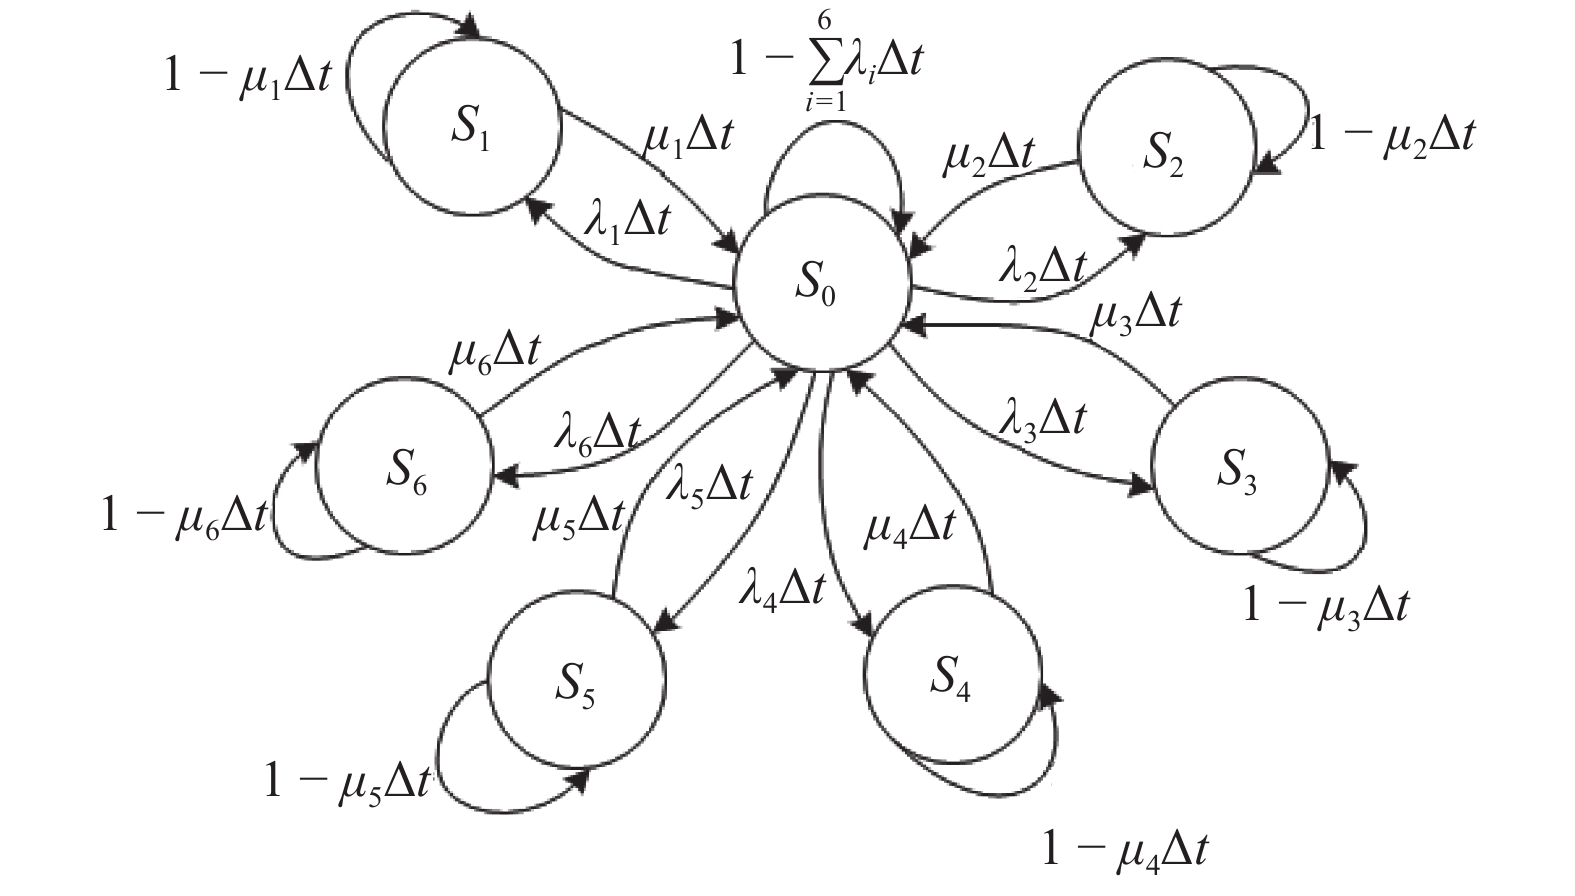
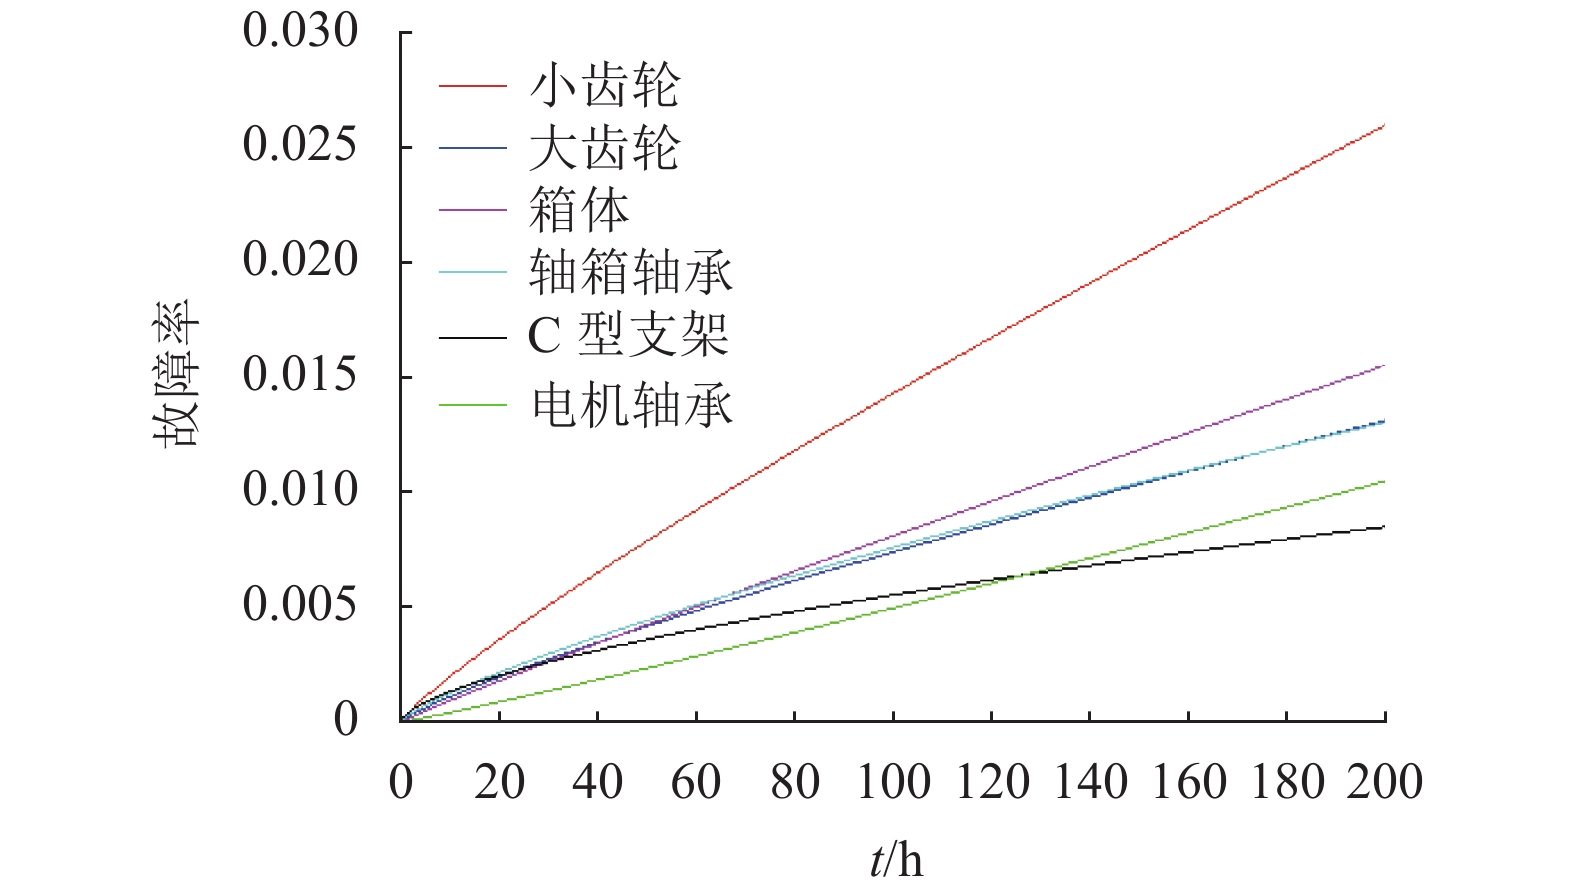
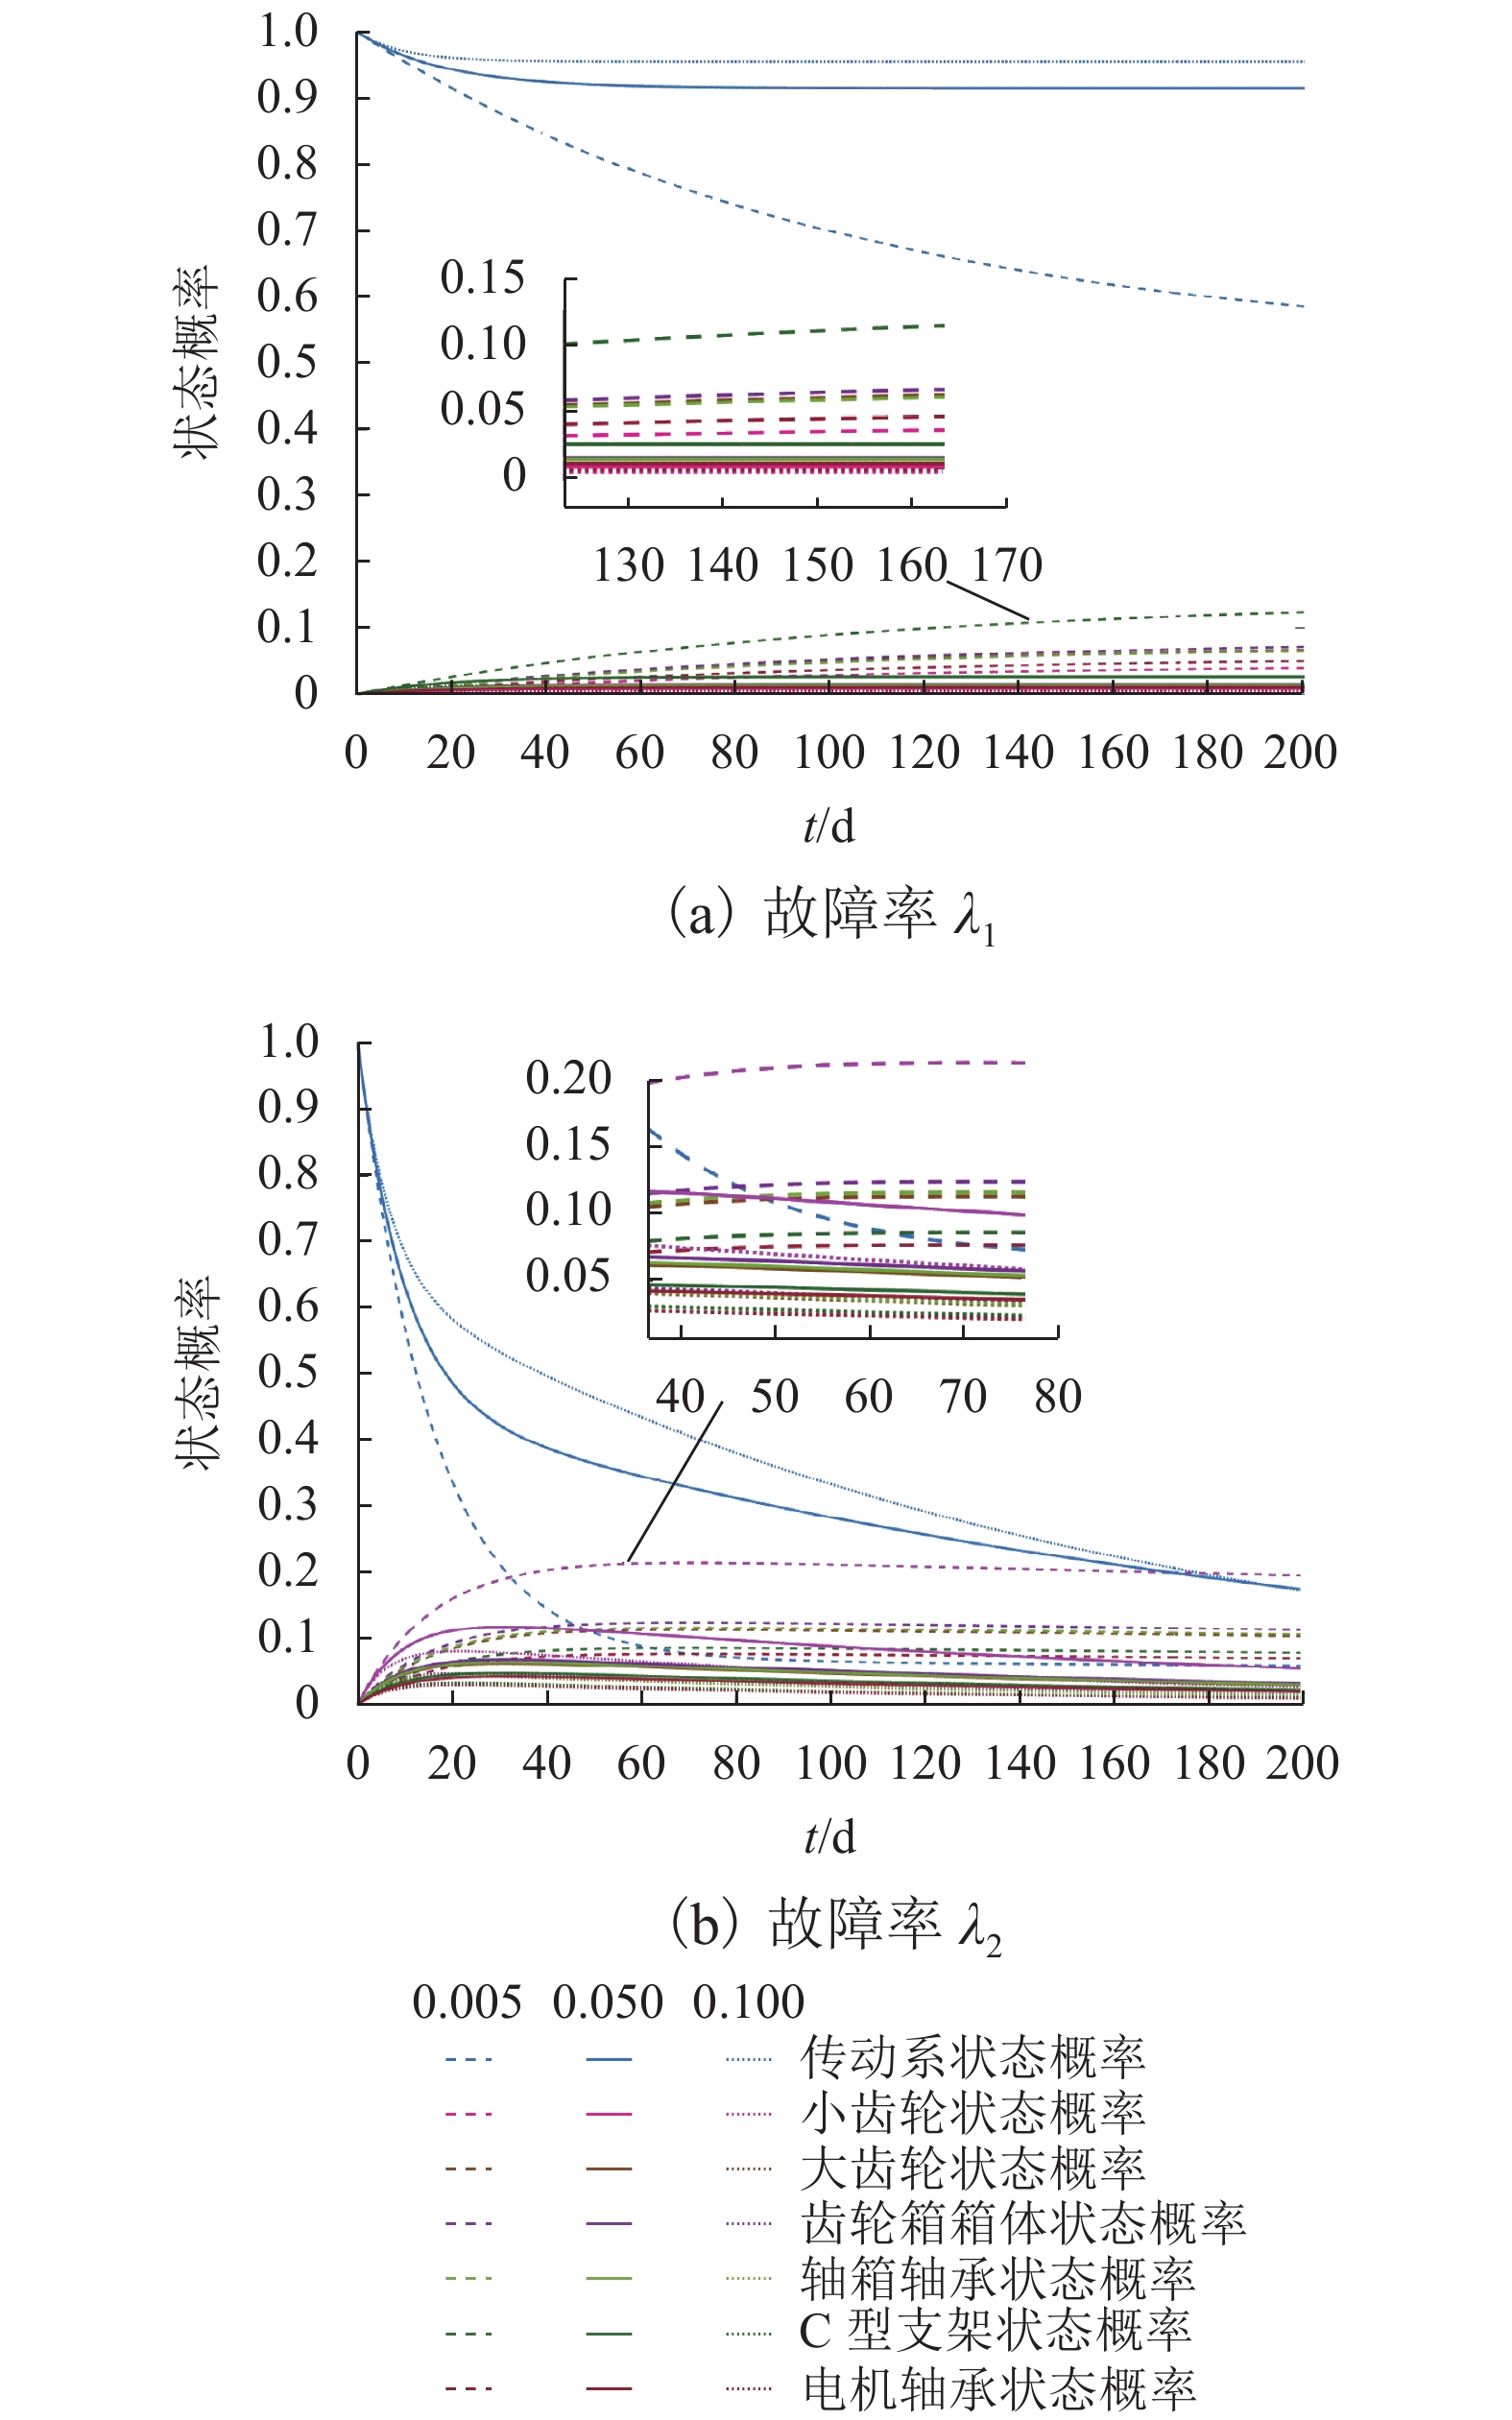
为研究高速列车运行过程中传动系的振动情况及可靠性,对CRH3型高速列车传动系关键部件的振动加速度数据进行实车采集,采用核密度估计(KDE)法对采集数据统计处理,得出各关键部件在各方向上振动响应的概率密度函数近似曲线,据此对传动系的关键部件进行振动评价;通过MATLAB计算各关键部件振动加速度的最优置信区间;对传动系及传动系的关键部件定义“安全”和“故障”两种状态,建立关键部件的威布尔比例失效率模型及传动系的Markov状态转移模型,以传动系当前状态为初始状态,基于实时故障率及维修率分析传动系可靠性的变化. 研究结果表明:传动系中轴箱轴承、齿轮箱以及电机轴承的垂向振动最强,振动加速度集中分布在25倍、20倍、10倍重力加速度范围内,概率99.75%的均方差值分别在20.5026倍、17.6712倍、11.4693倍重力加速度内;计算得到各关键部件振动加速度概率为99.75%的最优置信区间,为系统的振动监测阈值优化及故障评估提供参考;故障率及维修率是影响传动系统状态概率的关键因素,当故障率增加30%时,系统的状态概率约下降10%,当维修率由0.05提升至0.10时,可使系统的可靠性提高20%.
Abstract:In order to study the vibration and reliability of the transmission system during the operation of a high-speed train, the vibration acceleration data of the key components of the CRH3 high-speed train transmission system are collected for a real vehicle and the kernel density estimator (KDE) method is used in statistical processing. Through data processing, an approximate curve of the probability density function of the vibration response of each key component in all directions is obtained, and the vibration of the key components of the transmission system is evaluated using the curve. The optimal confidence interval of the vibration acceleration of each key component is calculated using MATLAB. Two states of “safe” and “failure” are defined for the transmission system and key components of the transmission system, and a Weibull model of the proportional failure rate of the key components and the Markov state transition model of the drive train are established. The current state of the drive train is the initial state. Changes in the reliability of the transmission system are analyzed using the real-time failure rate and maintenance rate. The results show that the vertical vibration is strongest for the axle box bearings, gearboxes, and motor bearings in the drive train, and the vibration acceleration is concentrated in the range of 25 times, 20 times, and 10 times the acceleration of gravity, with a probability of 99.75%, respectively. It is in the range of 20.5026 times, 17.6712 times, 11.4693 times the gravitational acceleration. The optimal confidence interval for the vibration acceleration probability of each key component to be 99.75% is calculated, which provides a reference for the optimization of the system’s vibration monitoring threshold and fault evaluation. The failure rate and maintenance rate are the key factors affecting the state probability of the transmission system. An increase in the failure rate of approximately 30% reduces the state probability of the system by approximately 10%, whereas an increase in the maintenance rate from 0.05 to 0.10 increases the reliability of the system by approximately 20%.
-
Key words:
- high-speed train /
- vibration acceleration /
- kernel density estimator /
- Markov /
- reliability
-
表 1 核密度估计窗宽
Table 1. Bandwidth of kernel density
×g 测点 h 测点 h 轴箱轴承 Y 向 0.1756 大齿轮 Y 向 0.1482 轴箱轴承 Z 向 0.4528 大齿轮 Z 向 0.1583 电机轴承 Y 向 0.0882 小齿轮 X 向 0.1121 电机轴承 Z 向 0.2532 小齿轮 Y 向 0.1230 齿轮箱箱体 X 向 0.1368 小齿轮 Z 向 0.0923 齿轮箱箱体 Y 向 0.2420 C 型支架 X 向 0.0803 齿轮箱箱体 Z 向 0.3902 C 型支架 Y 向 0.0705 大齿轮 X 向 0.1083 C 型支架 Z 向 0.0669 表 2 振动加速度均方差统计值
Table 2. Vibration acceleration
$3\sigma $ statistics×g 测点 均方差 测点 均方差 轴箱轴承 Y 向 7.9527 大齿轮 Y 向 6.7098 轴箱轴承 Z 向 20.5026 大齿轮 Z 向 7.1700 电机轴承 Y 向 3.9957 小齿轮 X 向 5.0722 电机轴承 Z 向 11.4693 小齿轮 Y 向 5.5701 齿轮箱箱体 X 向 6.1932 小齿轮 Z 向 4.1790 齿轮箱箱体 Y 向 10.9449 C 型支架 X 向 3.6375 齿轮箱箱体 Z 向 17.6712 C 型支架 Y 向 3.1926 大齿轮 X 向 4.9062 C 型支架 Z 向 3.0294 表 3 最优置信区间
Table 3. Optimal confidence interval
×g 测点 置信区间 测点 置信区间 轴箱轴承 Y 向 [−8.6182,9.6198] 大齿轮 Y 向 [−8.1821,7.7852] 轴箱轴承 Z 向 [−23.6998,22.8190] 大齿轮 Z 向 [−7.9711,8.9677] 电机轴承 Y 向 [−4.1076,4.0275] 小齿轮 X 向 [−5.6593,5.7762] 电机轴承 Z 向 [−10.6325,10.2813] 小齿轮 Y 向 [−5.9041,6.2235] 齿轮箱箱体 X 向 [−6.6795,6.3014] 小齿轮 Z 向 [−4.5194,4.8815] 齿轮箱箱体 Y 向 [−10.7730,10.4259] C 型支架 X 向 [−3.9512,3.8502] 齿轮箱箱体 Z 向 [−16.9872,19.5439] C 型支架 Y 向 [−3.1006,3.1129] 大齿轮 X 向 [−5.9240,5.9666] C 型支架 Z 向 [−3.2303,3.2141] 表 4 威布尔模型参数估计数值
Table 4. Weibull model parameter estimates
威布参数 β η γ1 γ2 γ3 小齿轮 1.861 308.79 0.3025 0.4859 大齿轮 1.827 324.65 0.0672 0.4173 箱体 1.938 320.91 0.2010 0.1286 轴箱轴承 1.781 330.71 0.2064 0.0211 0.0488 C 型支架 1.621 307.48 0.0179 0.2091 电机轴承 2.079 311.77 0.1010 0.1611 表 5 各关键部件实时故障率
Table 5. Real-time failure rate of key components
×10−2 关键部件 t1=100 h t2=140 h 电机轴承 0.44 0.67 轴箱轴承 0.76 0.95 箱体 0.81 1.06 大齿轮 0.74 0.94 小齿轮 1.40 1.85 C 型支架 0.56 0.63 -
[1] 许思思,黄冠华,姜海博,等. 高速列车齿轮箱振动烈度评价方法探讨[J]. 铁道技术监督,2017,45(11): 30-32. doi: 10.3969/j.issn.1006-9178.2017.11.010XU Sisi, HUANG Guanhua, JIANG Haibo, et al. Discussion on evaluation method of vibration intensity of gearbox of high speed train[J]. Railway Quality Control, 2017, 45(11): 30-32. doi: 10.3969/j.issn.1006-9178.2017.11.010 [2] 李梅林,李毅强,谢惠民,等. 车用发动机振动测试研究[J]. 湖南大学学报(自然科学版),2003,30(2): 42-44.LI Hailin, LI Yiqiang, XIE Huimin. Study on vehicle engine vibration test[J]. Journal of Hunan University (Natural Sciences), 2003, 30(2): 42-44. [3] 邓晓宇. 高速列车齿轮传动系统动态特性仿真与评价方法研究[D]. 成都: 西南交通大学, 2016. [4] 刘远龙. 核密度估计中的窗宽选择方法[D]. 合肥: 中国科学技术大学, 2013. [5] 杨腾飞. 基于失效物理相关性的风电齿轮箱可靠性分[D]. 兰州: 兰州理工大学, 2017.4. [6] 高延杰,杨永发,陈炯,等. 基于核密度估计算法的T100C列车转向架载荷谱统计研究[J]. 机械强度,2016,38(6): 1330-1334.GAO Yanjie, YANG Yongfa, CHEN Jong, et al. A research on load spectrum statistical analysis of T100C train bogie based on kernel density estimation algorithm[J]. Journal of Mechanical Strength, 2016, 38(6): 1330-1334. [7] 王俊明,茹杨,陈瑜,等. 基于余弦核函数在Solve-the-Equation 方法下的核密度估计[J]. 哈尔滨理工大学学报,2016,12(1): 114-122.WANG Junming, RU Yang, CHEN Yu, et al. Solve-the-Equation kernel density estimation method based on cosine kernel function[J]. Journal of Harbin University of Science and Technology, 2016, 12(1): 114-122. [8] ZHAO X X, JUN Y. Kernel density estimation of traffic accidents in a network space[J]. Computers,Environment and Urban System, 2008(32): 396-406. [9] 郑伟,朱洪磊,符锌砂,等. 基于核密度估计的交通流速度分布[J]. 公路工程,2018,43(2): 113-117. doi: 10.3969/j.issn.1674-0610.2018.02.021ZHENG Wei, ZHU Honglei, FU Xinsha, et al. Velocity distribution of traffic flow based on kernel density estimation[J]. Highway Engineering, 2018, 43(2): 113-117. doi: 10.3969/j.issn.1674-0610.2018.02.021 [10] 赵聪聪. 高速列车传动系统可靠性分析与评估[D]. 长春: 吉林大学, 2016: 24-25. [11] IEC. 铁路应用—机车车辆设备—冲击和振动实验: IEC61373—2010[P]. 2版. 日内瓦: [s.n.], 2010. [12] 于敏,何正友,钱清泉. 基于Markov模型的可维修双机热备系统可靠性分析[J]. 计算机工程与设计,2009,30(8): 2040-2046.YU Min, HE Zhengyou, QIAN Qingquan. Reliability analysis of repairable hot stand-by redundant system based on Markov model[J]. Computer Engineering and Design, 2009, 30(8): 2040-2046. [13] 丁锋,何正嘉,訾艳阳,等. 基于设备状态振动特征的比例障率模型可靠性评估[J]. 机械工程学报,2009,45(12): 95-100. doi: 10.3901/JME.2009.12.095DING Feng, HE Zhengjia, ZI Yanyang, et al. Reliability assessment based on equipment condition vibration feature using proportional hazards model[J]. Journal of Mechanical Engineering, 2009, 45(12): 95-100. doi: 10.3901/JME.2009.12.095 [14] 魏利胜,费敏锐. 基于马尔可夫模型的NCS可靠性分[J]. 工业仪表与自动化装置,2007,2(5): 6-8. doi: 10.3969/j.issn.1000-0682.2007.05.002WEI Lisheng, FEI Minrui. A reliability analysis of NCS based on the Markov model[J]. Industrial Instrumentation & Automation, 2007, 2(5): 6-8. doi: 10.3969/j.issn.1000-0682.2007.05.002 -


 下载:
下载:
