

Multi-stage Quality Prediction of Batch Process Based on KECA and MBA-NARX
-
摘要:
间歇过程产品质量与过程特性或过程反应原理密切相关,为解决其过程数据呈现的多阶段性、时序性和动态性的问题,提出一种基于带外源输入的非线性自回归(NARX)神经网络进行多阶段质量预测. 首先,对间歇过程数据进行K均值(K-means)聚类阶段划分和核熵成分分析(KECA)数据降维,保证输入数据阶段特征的同时提升后续预测过程的效率;然后,在各阶段内构造NARX预测模型,利用改进蝙蝠算法(MBA)优化网络的隐含层节点数,实现间歇过程在线质量预测;最后,利用青霉素仿真实验数据验证所提方法的有效性. 研究结果表明:NARX神经网络开环模式具有较好的预测效果,核熵成分分析的数据降维方式更有利于后续的质量预测研究;MBA对于网络隐含层节点数的优化效率高、稳定性好,阶段划分可以一定程度上提高间歇过程的预测性能,提出的多阶段质量预测模型预测性能较高,均方根误差和平均绝对百分比误差分别达到0.02和1.20%.
Abstract:The product quality of batch process is closely related to the process characteristics or the process reaction principle. In order to solve the problems of multistage, time sequence and dynamics of batch process data, a multistage quality prediction method based on nonlinear autoregressive with exogeneous inputs (NARX) neural network is proposed. First, the batch process data are divided into stages by the K-means, and the data dimension is reduced using the kernel entropy component analysis (KECA). These works can improve the prediction efficiency of the subsequent process while ensuring the stage characteristics of the input data. Then, the NARX prediction model is constructed in each stage, and the number of hidden layer nodes of the network is optimized by using the improved bat algorithm (MBA) to realize the online quality prediction of batch processes. The penicillin simulation data is used to verify the effectiveness of the proposed method. The results show that the open-loop structure of the NARX neural network has a good prediction effect, and the data dimensionality reduction method of the KECA is more conducive to subsequent quality prediction research. MBA optimizes the number of hidden layer nodes in the network with higher efficiency and better stability. The stage division can improve the prediction performance of the batch process to a certain extent. The proposed multi-stage quality prediction model has higher prediction performance, its root means square error and the mean absolute percentage error reached 0.02 and 1.48%.
-
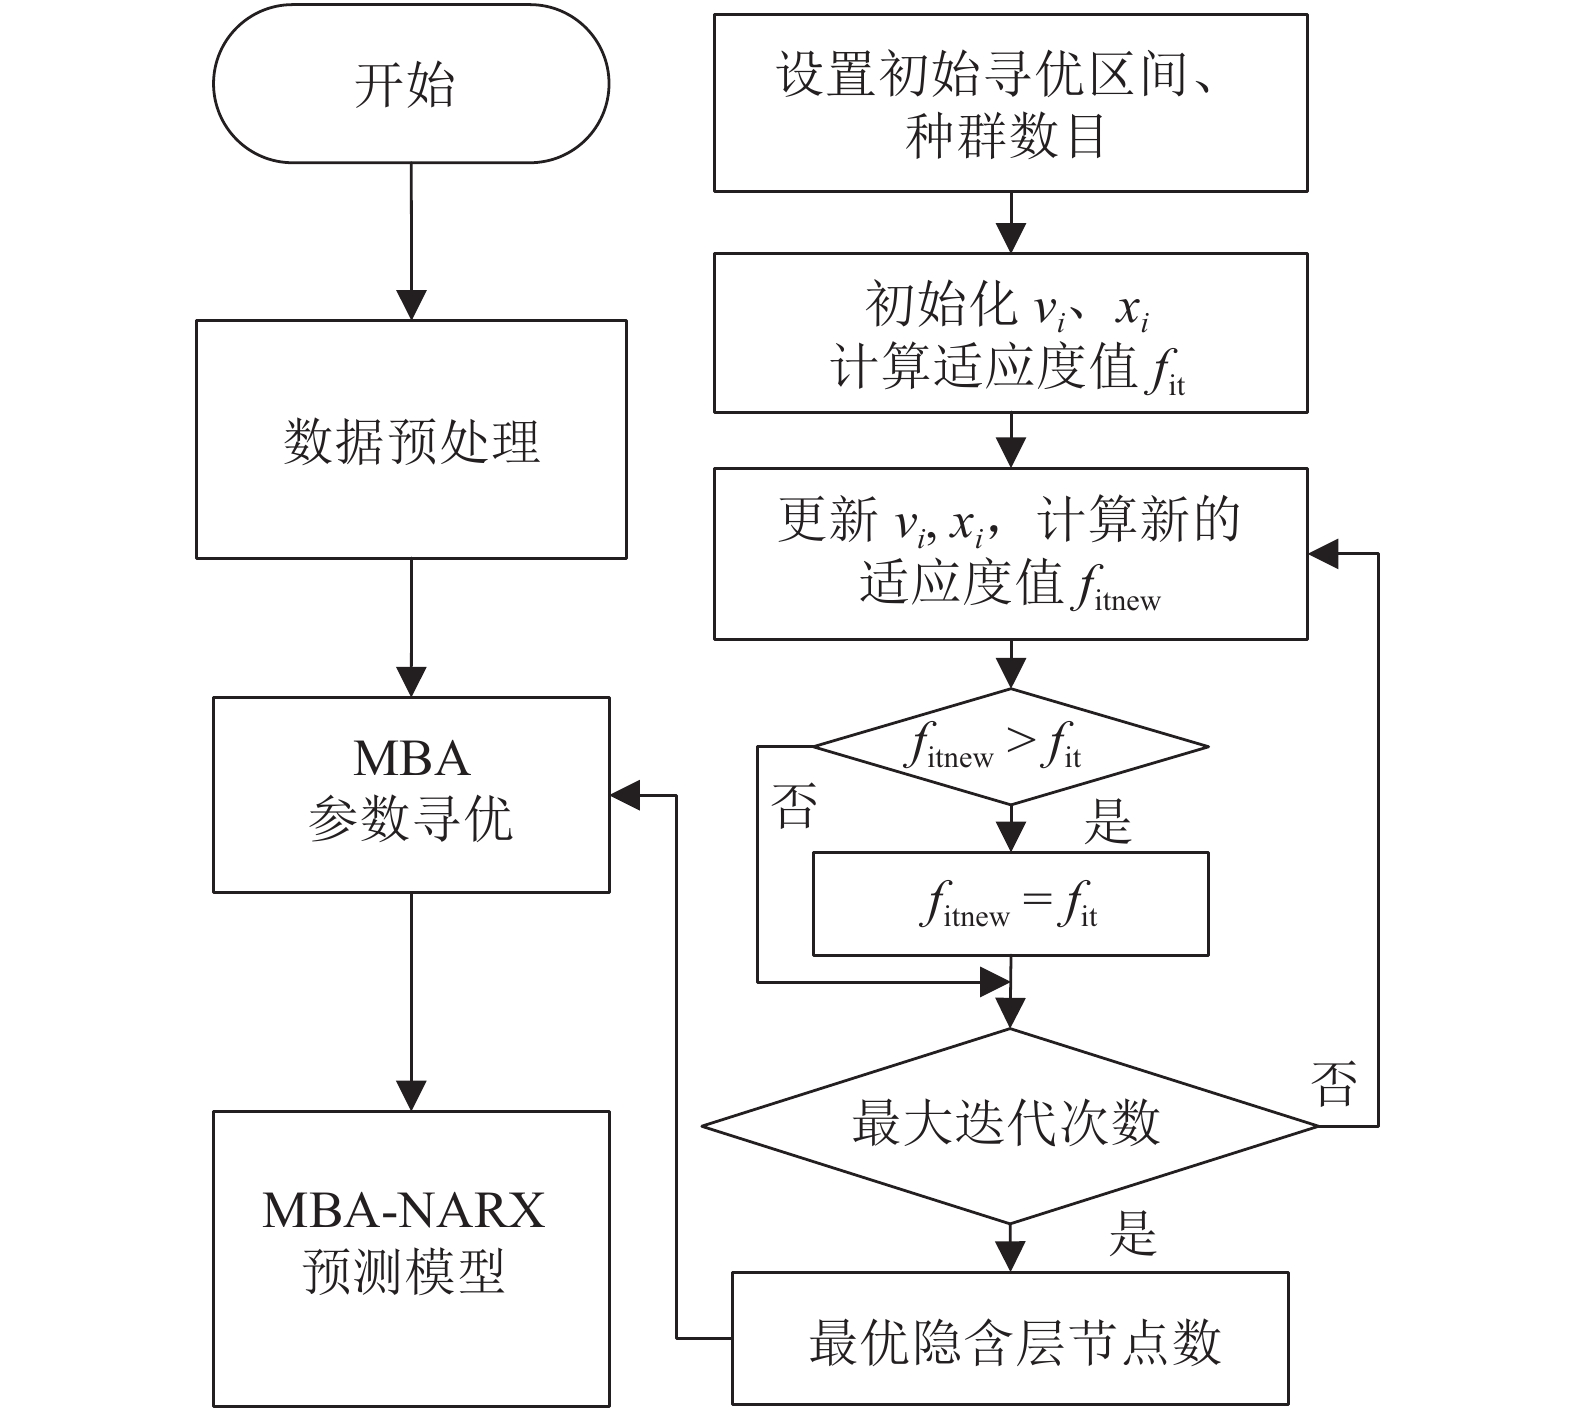
图 4 MBA优化NARX隐含层节点数流程
Figure 4. Flow chart of MBA optimized the number in NARX hidden layer
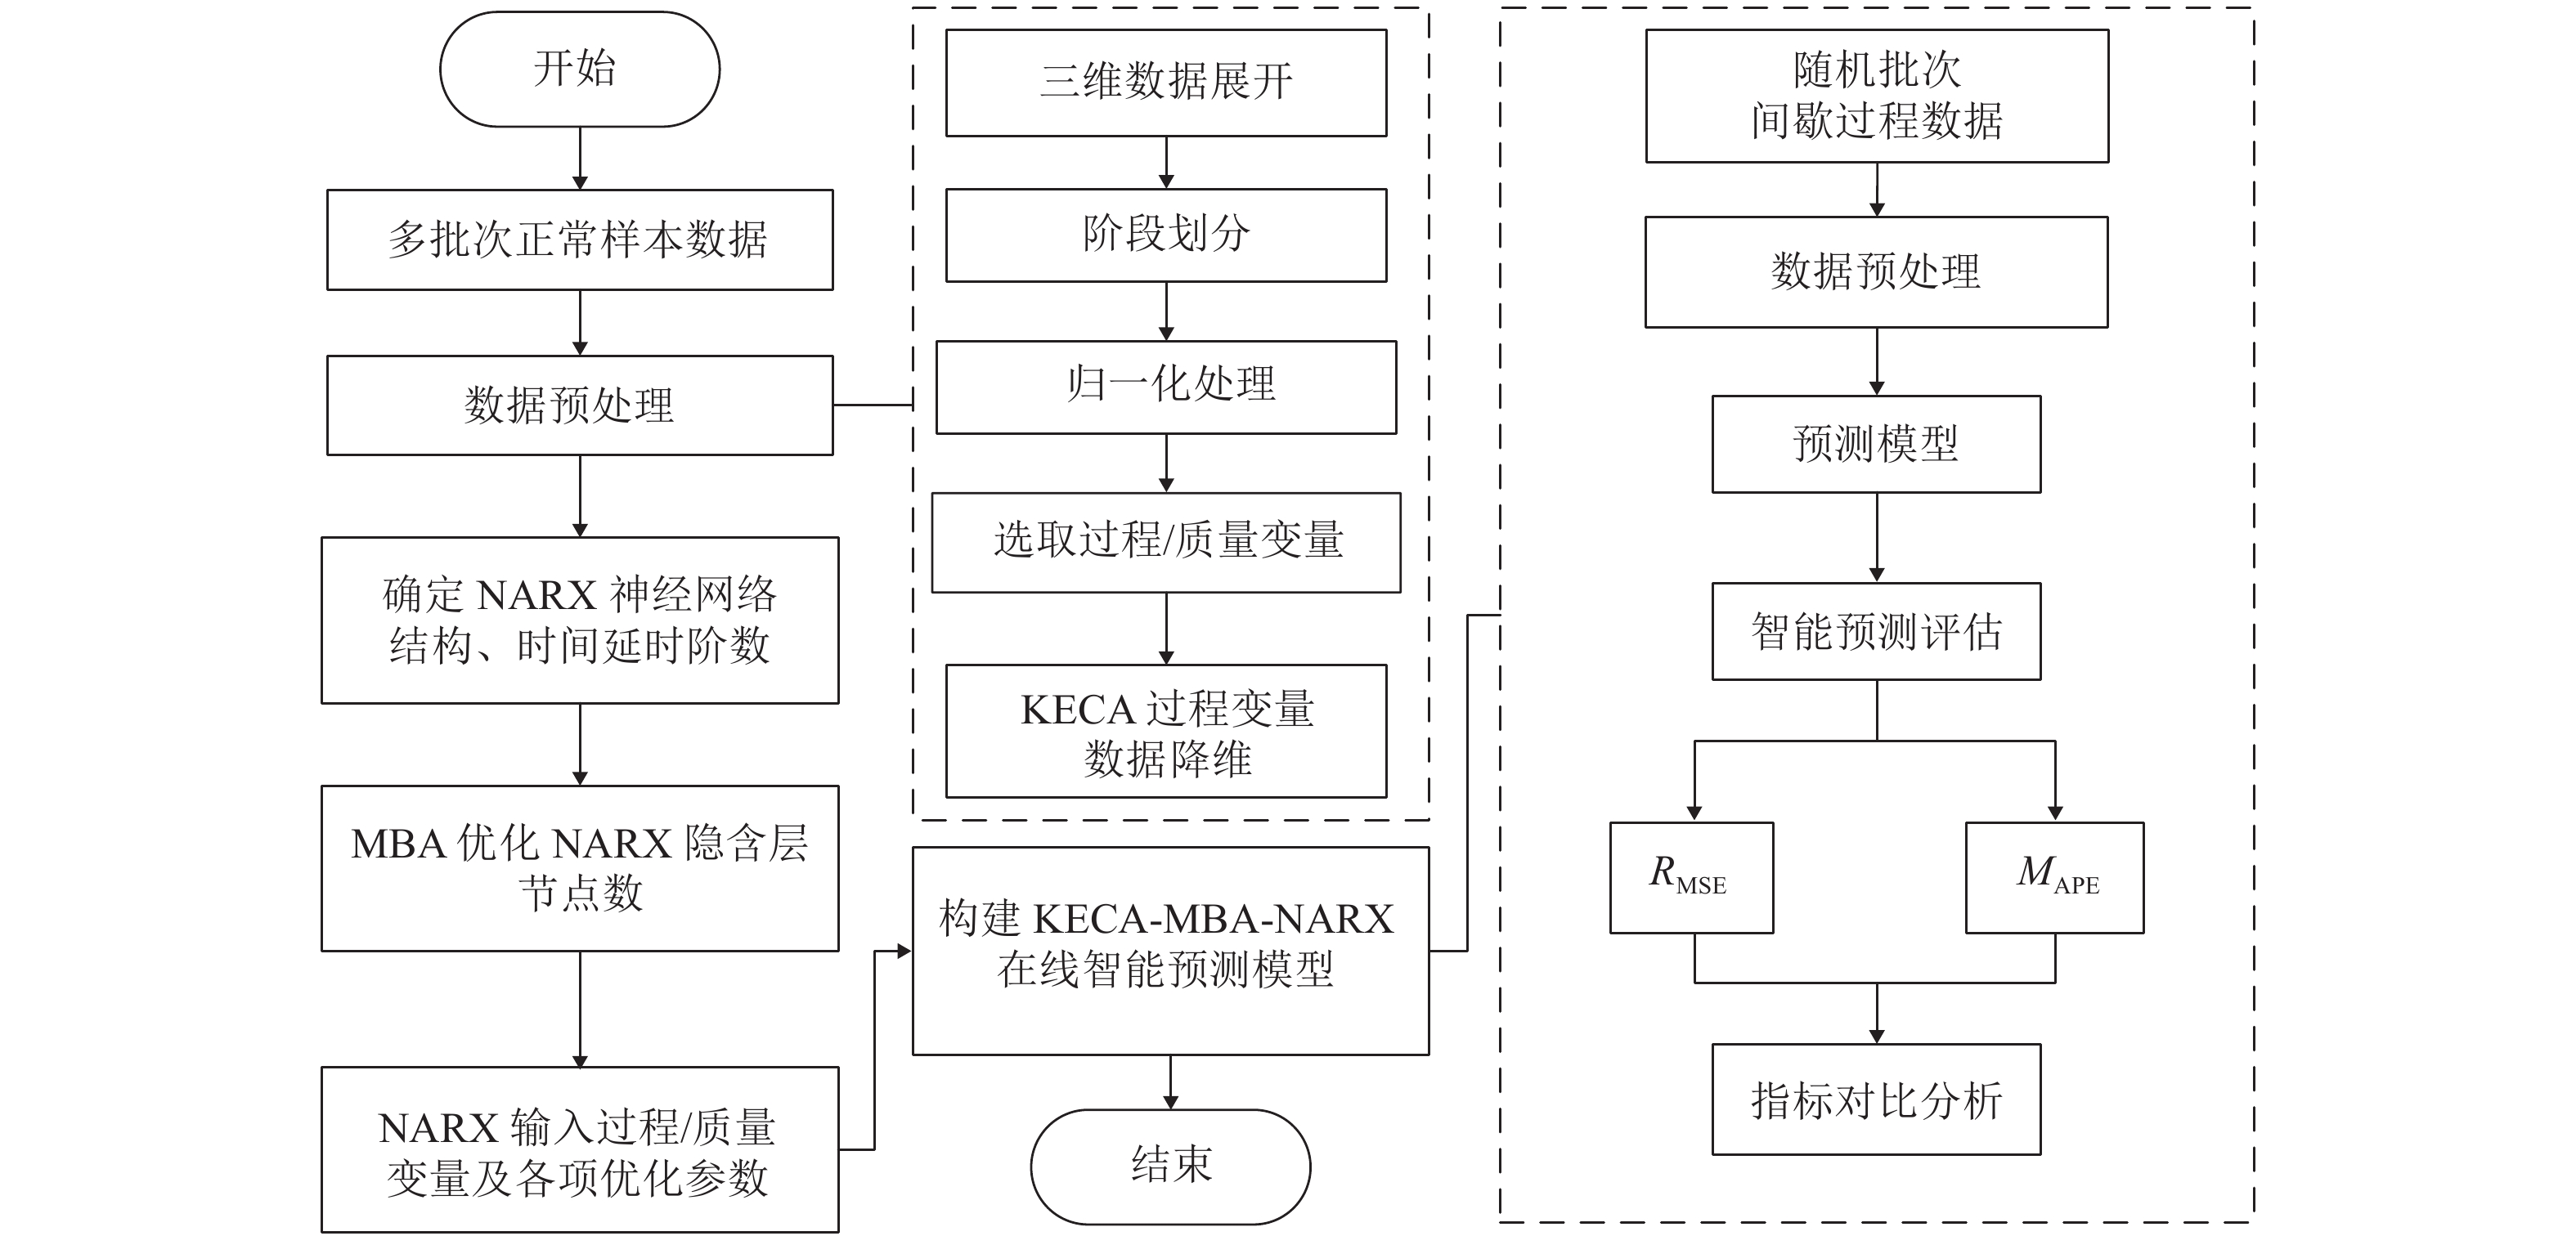
图 5 基于KECA和MBA-NARX的间歇过程多阶段预测
Figure 5. Multi-stage prediction of batch process based on KECA and MBA-NARX
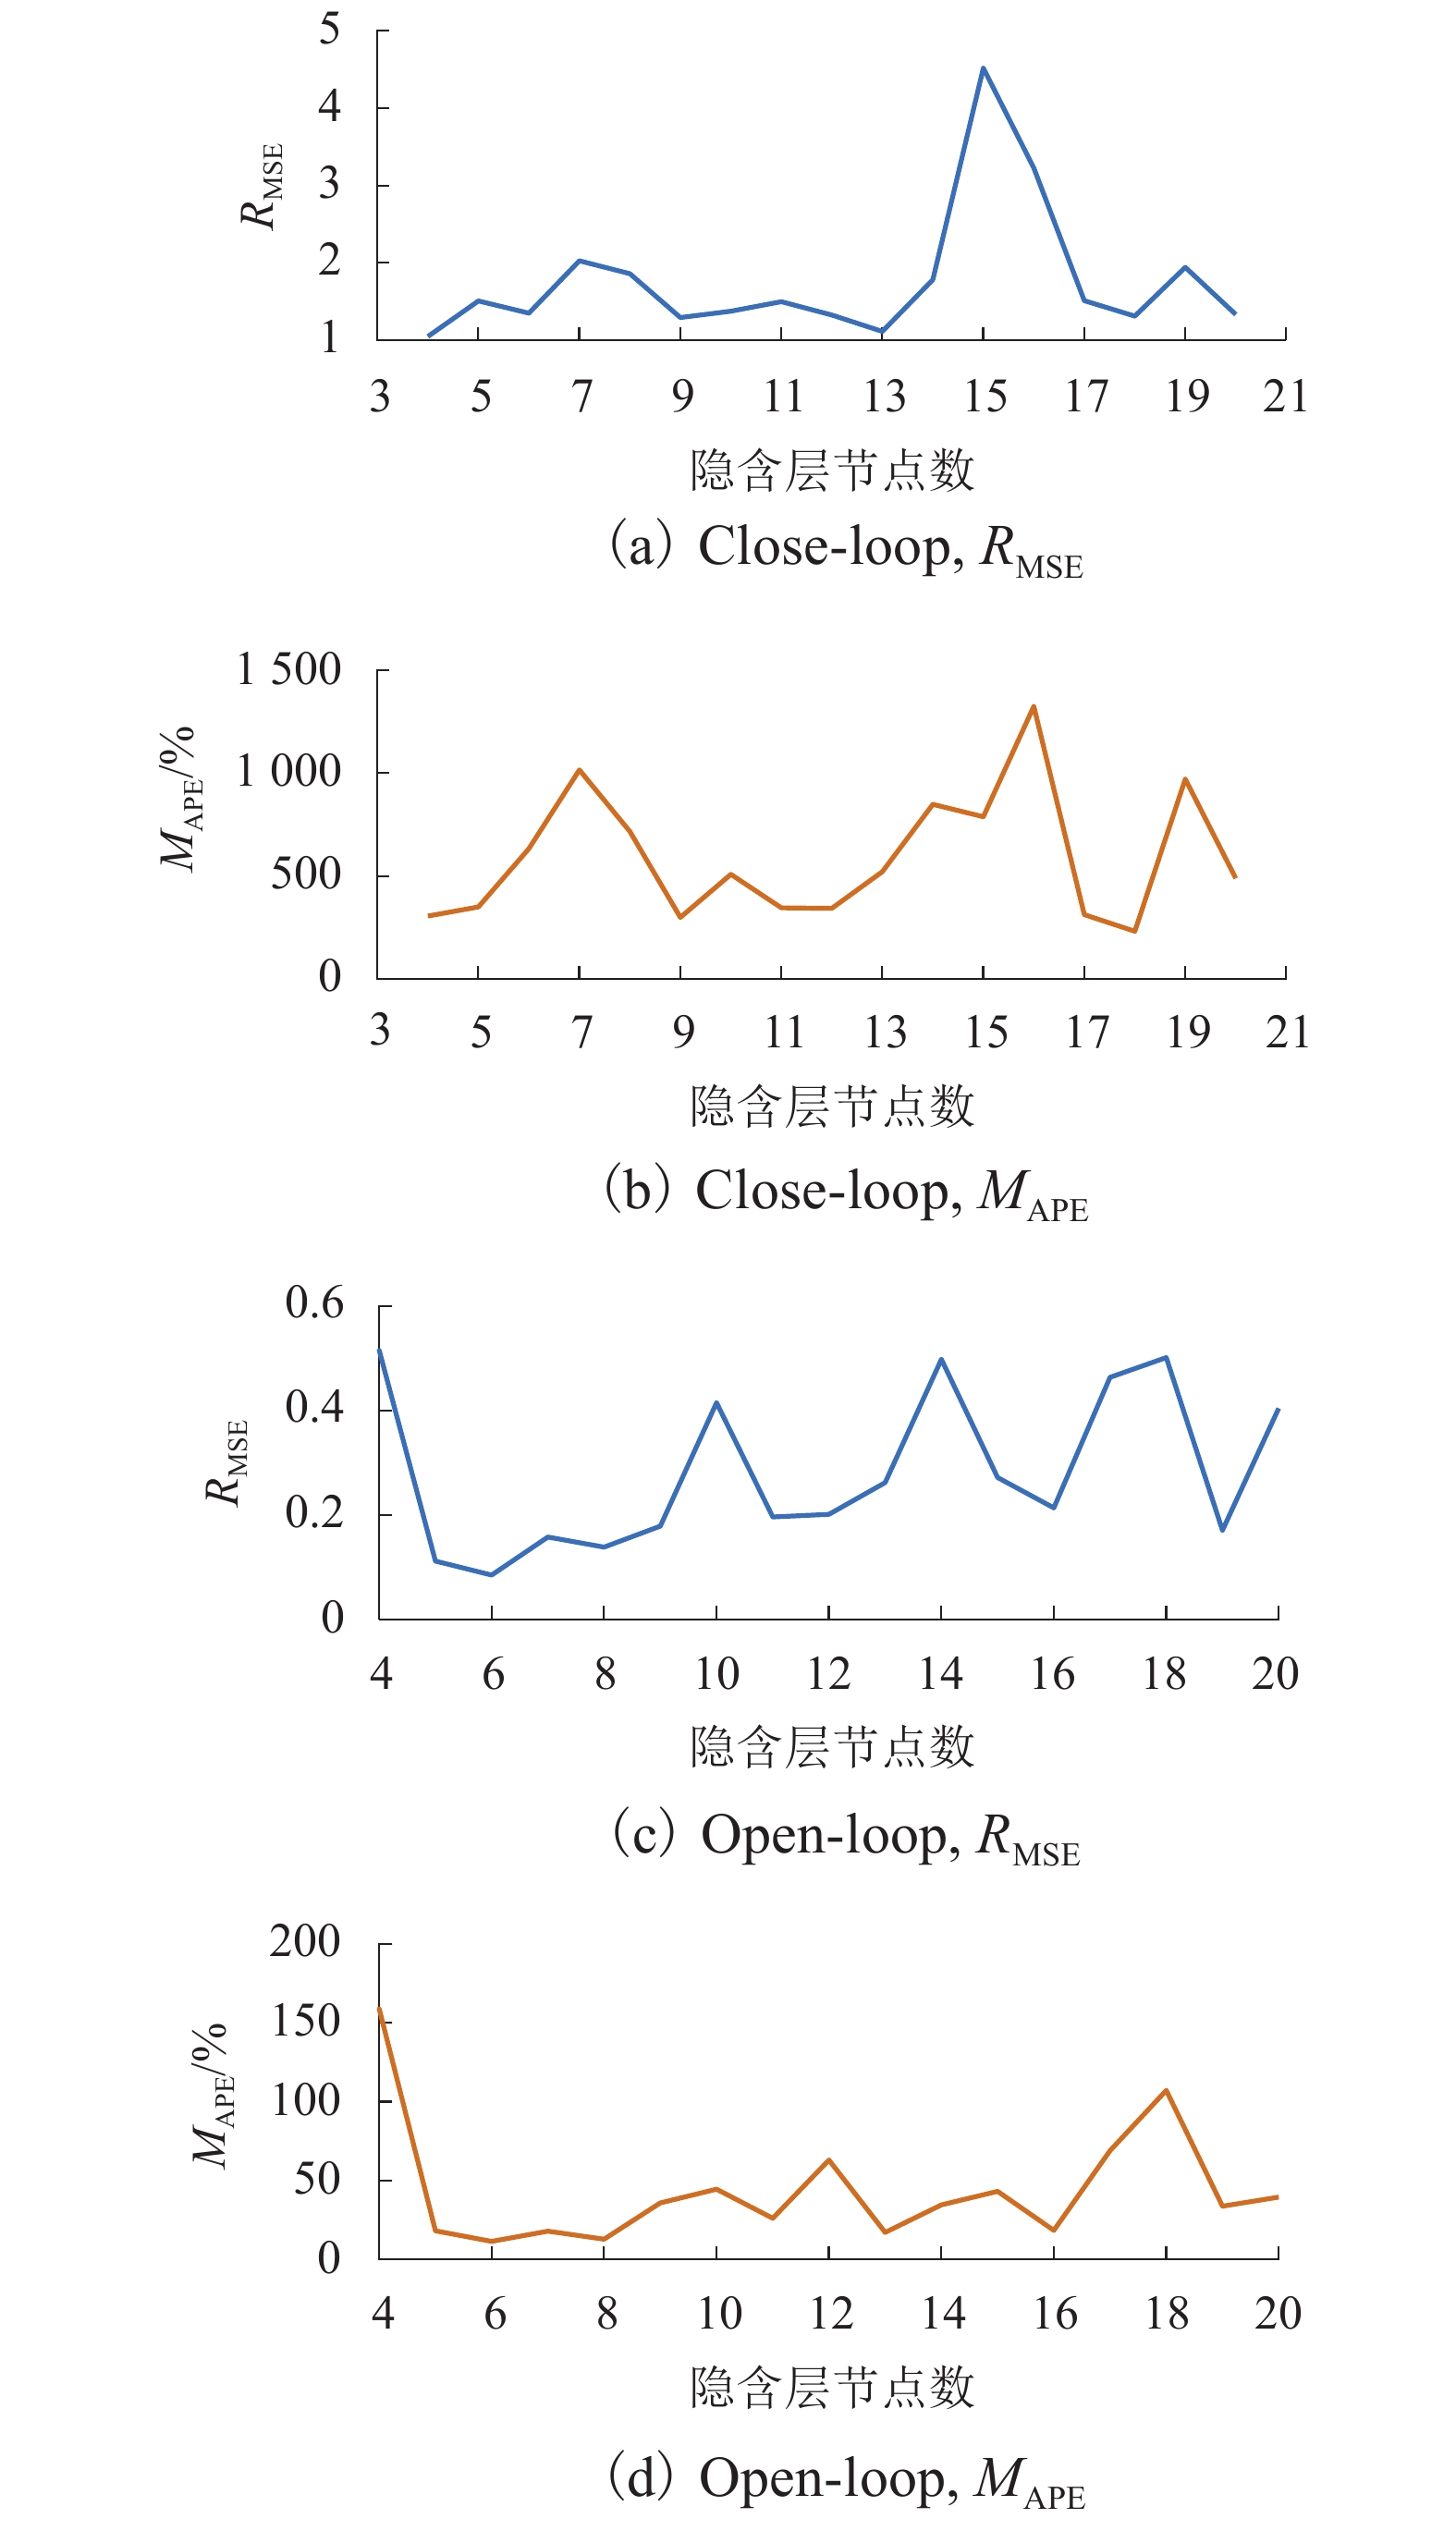
图 7 RMSE和MAPE随隐含层节点数变化趋势
Figure 7. The trend of RMSE and MAPE with the number of hidden layer nodes under the close/open-loop
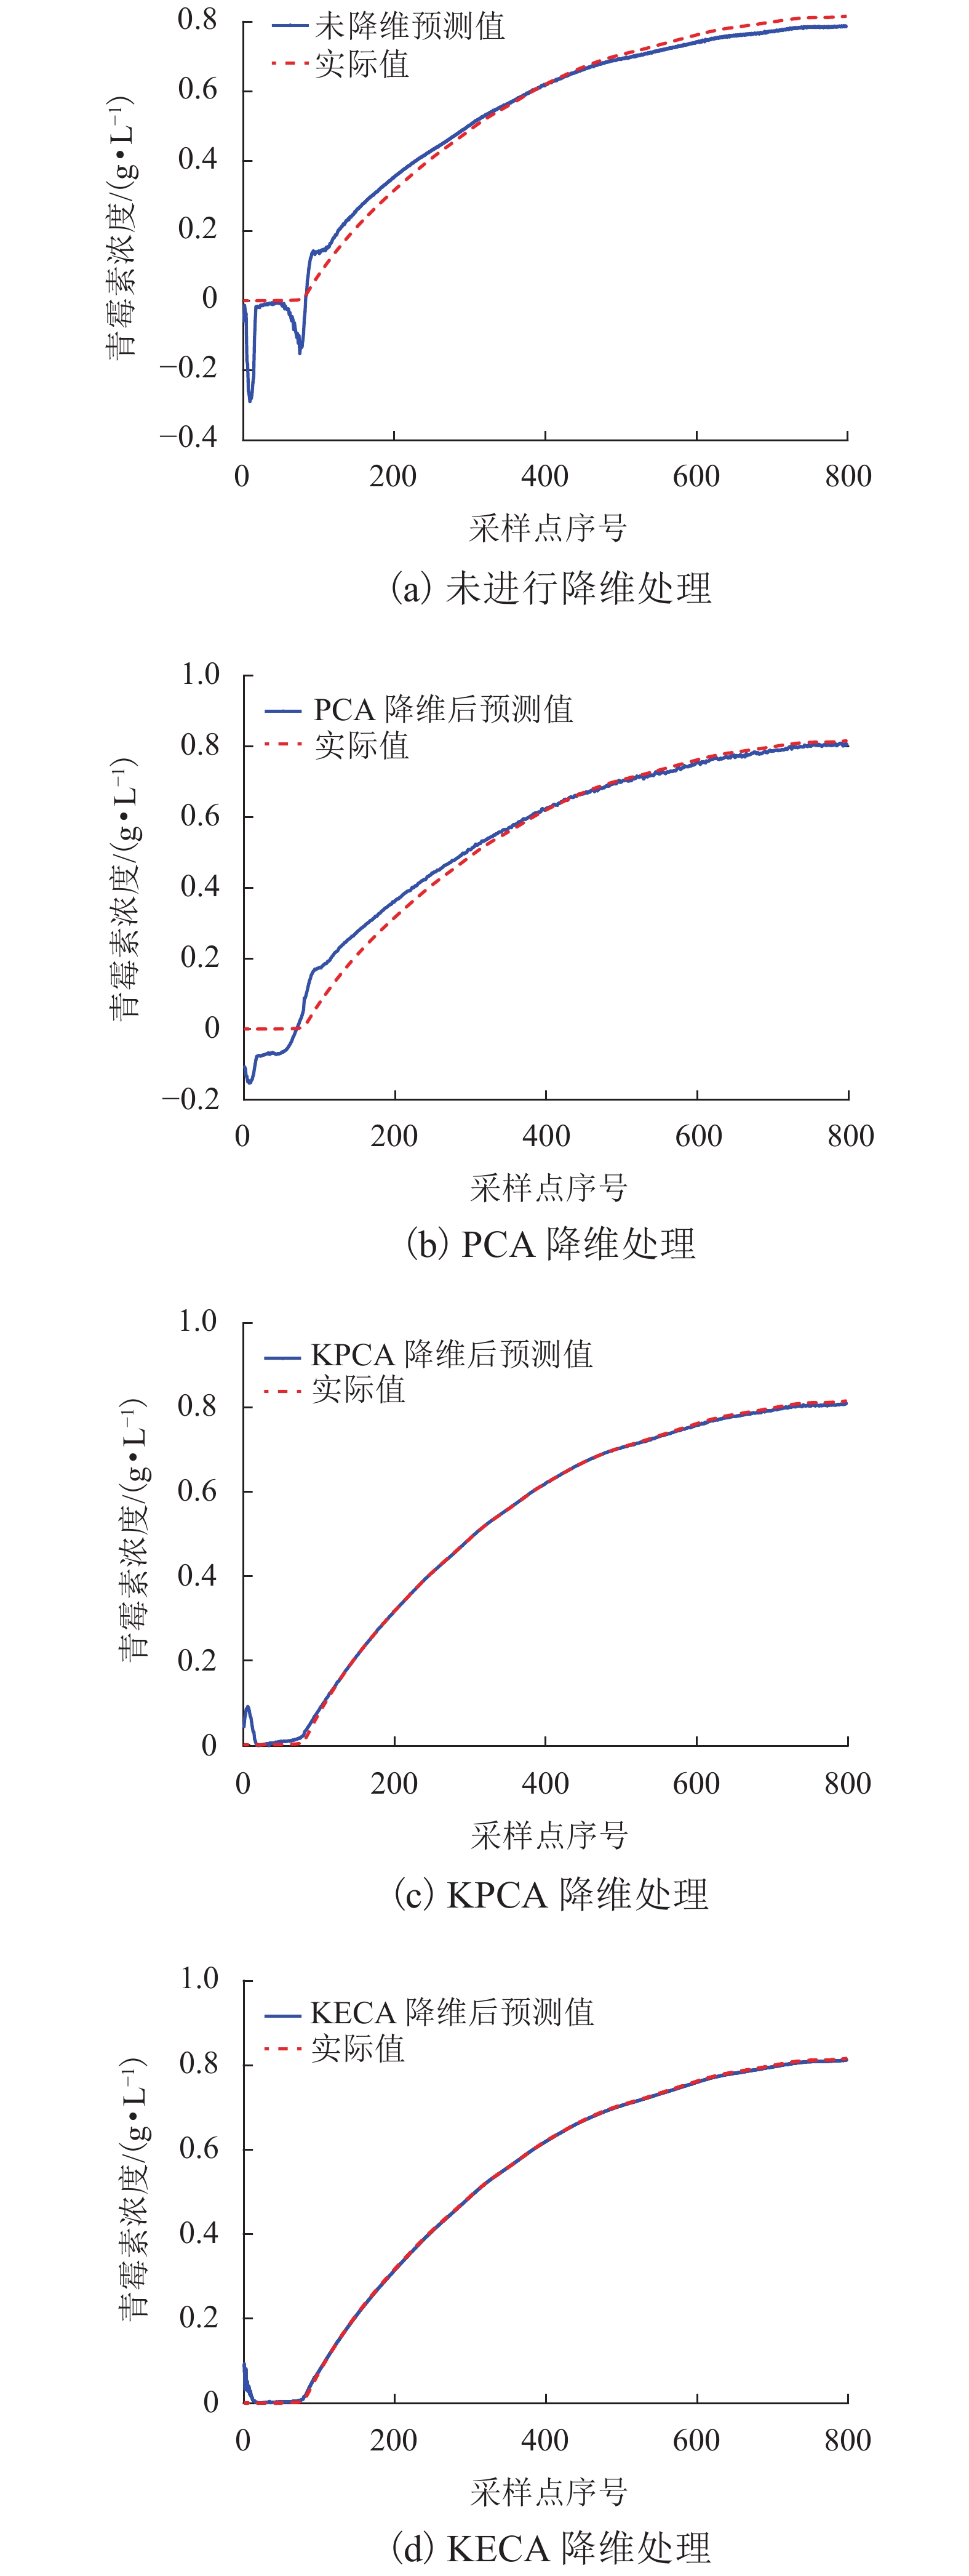
图 9 不同降维方法后的预测结果
Figure 9. Prediction results of different dimensionality reduction methods
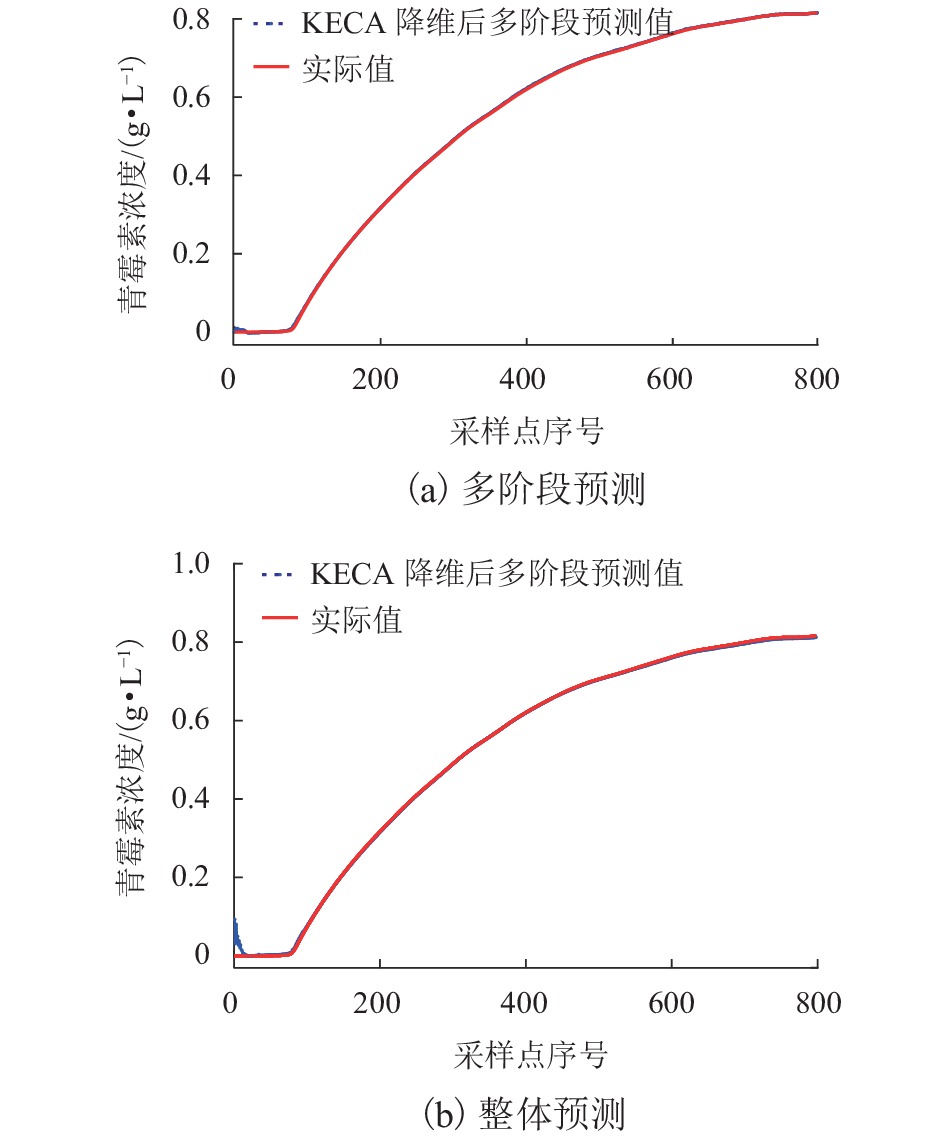
图 10 多阶段预测与整体预测对比
Figure 10. Comparison between multi-stage prediction and overall prediction
表 1 过程变量说明
Table 1. Description of process variables
变量号 变量名称 变量号 变量名称 1 通风率/(L•h−1) 9 排气二氧化碳浓度/
(Mmol•L−1)2 搅拌速率/
(r•min−1)10 pH 值 3 底物流加速率/
(L•h−1)11 温度/K 4 补料温度/K 12 产生热/K 5 基质浓度/(g•L−1) 13 酸流加速率/(L•h−1) 6 溶解氧浓度/% 14 碱流加速率/(L•h−1) 7 菌体浓度/(g•L−1) 15 冷水流加速率/(L•h−1) 8 反应器体积/L 16 热水流加速率/(L•h−1)  下载: 导出CSV
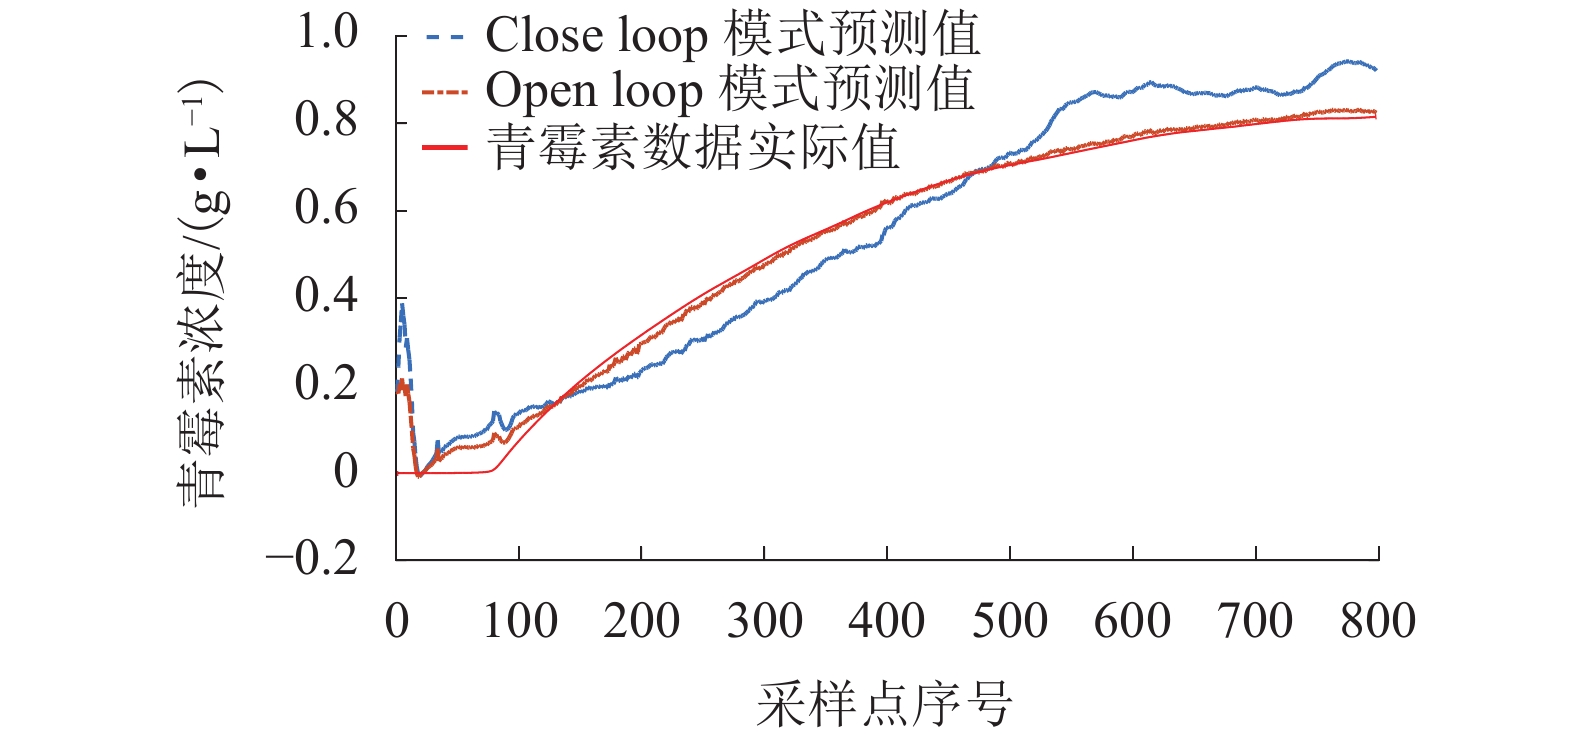
表 2 NARX两种结构下的RMSE和MAPE区间范围
Table 2. The range of RMSE and MAPE in the two NARX structures
模式 RMSE MAPE/% Close-loop [1,5] [200,1500] Open-loop [0,0.60] [0,200]
下载: 导出CSV
表 4 各算法初始参数
Table 4. Initial parameters of each algorithm
算法 参数 对应值或区间 PSO 种群大小 20 最大迭代数/次 20 速度区间 [1,16] 加速度因子1、2 2、2 GA 种群大小 20 最大迭代数/次 20 交叉概率 0.4 变异概率 0.01 MBA 种群大小 20 最大迭代数/次 20 响度 0.25 频率区间 [0,2] 位置更新区间 [1,16]
下载: 导出CSV
表 5 3种参数优化模型对比
Table 5. Comparison of three parameter optimization models
预测指标 PSO-NARX GA-NARX MBA-NARX 迭代
时间/s标准差/×10−4 验证集
误差迭代
时间/s标准差/×10−4 验证集
误差迭代
时间/s标准差/×10−4 验证集
误差产物浓度 200.56 16.70 0.024 1006.87 10.42 0.012 144.78 5.60 0.008 菌体浓度 181.42 10.66 0.687 894.91 7.58 0.298 134.39 3.40 0.144 基质浓度 240.38 21.52 0.376 1307.42 19.04 0.033 149.89 10.50 0.055 均值 207.45 16.30 0.360 1069.73 12.35 0.110 143.02 6.54 0.070
下载: 导出CSV
表 6 阶段预测结果
Table 6. Comparison of stages prediction effects
阶段/h RMSE MAPE/% 总体RMSE 总体MAPE/% 预测
用时/s0~38 0.04 2.83 0.02 1.20 51.72 39~169 0.01 0.78 170~280 0.01 0.84 281~400 0.02 1.47 0~400 0.04 2.60 0.04 2.60 22.06
下载: 导出CSV
-
[1] 王普,曹彩霞,高学金. 基于扩展得分矩阵的多阶段间歇过程质量预测[J]. 高校化学工程学报,2019,33(3): 664-671. doi: 10.3969/j.issn.1003-9015.2019.03.021WANG Pu, CAO Chaixia, GAO Xuejin. Quality prediction of multistage batch processes based on extended score matrices[J]. Journal of Chemical Engineering of Chinese Universities, 2019, 33(3): 664-671. doi: 10.3969/j.issn.1003-9015.2019.03.021 [2] ALSHAWARGHI H, ELKAMEL A, MOSHIRI B, et al. Predictive models and detection methods applicable in water detection framework for industrial electric arc furnaces[J]. Computers & Chemical Engineering, 2019, 128(6): 285-300. [3] 李和平. 基于核函数的间歇过程软分段建模方法研究[D]. 北京: 北京化工大学, 2015. [4] 王新普,周想凌,邢杰,等. 一种基于改进灰色BP神经网络组合的光伏出力预测方法[J]. 电力系统保护与控制,2016,44(18): 81-87. doi: 10.7667/PSPC151675WANG Xinpu, ZHOU Xiangling, XING Jie, et al. A prediction method of PV output power based on the combination of improved grey back propagation neural network[J]. Power System Protection and Control, 2016, 44(18): 81-87. doi: 10.7667/PSPC151675 [5] HUANG Y S, HU J J, LIU H, LIU S J. Research on price forecasting method of China's carbon trading market based on PSO-RBF algorithm[J]. Systems Science & Control Engineering, 2019, 7(2): 40-47. [6] 李应求,安勃,李恒通. 基于NARX及混沌支持向量机的短期风速预测[J]. 电力系统保护与控制,2019,47(23): 65-73.LI Yingqiu, AN Bo, LI Hengtong. Short-term wind speed prediction based on NARX and chaos-support vector machine[J]. Power System Protection and Control, 2019, 47(23): 65-73. [7] 庞学苗. 基于人工神经网络的轮轨力预测[D]. 南京: 南京理工大学, 2012. [8] 吴启蒙,魏明,庞雷. 基于NARX神经网络的电子电路电磁脉冲响应建模[J]. 高压电器,2013,49(11): 62-68.WU Qimeng, WEI Ming, PANG Lei. Modelling electromagnetic pulse response of electronic circuits based on NARX neural network[J]. High Voltage Apparatus, 2013, 49(11): 62-68. [9] MAHDI S, MOHAMMAD B. Real-time estimation of break sizes during LOCA in nuclear power plants using NARX neural network[J]. Nuclear Engineering and Technology, 2019, 51(1): 702-708. [10] CARLOS A, JUAN P, MARTI N, et al. Recurrent neural network model with Bayesian training and mutual information for response prediction of large buildings[J]. Engineering Structures, 2019, 178(1): 603-615. [11] 焦博隆,钟志贤,刘翊馨,等. 基于蝙蝠算法优化的变分模态分解的转子裂纹检测方法[J]. 振动与冲击,2020,39(6): 98-103.JIAO Bolong, ZHONG Zhixian, LIU Yuxin, et al. Rotor crack detection method based on variational mode decomposition based on optimization parameters of bat algorithm[J]. Journal of Vibration and Shock, 2020, 39(6): 98-103. [12] 王仲,顾煜炯,韩旭东,等. 基于历史数据聚类的火电机组工况划分[J]. 仪器仪表学报,2019,40(2): 90-95.WANG Zhong, GU Yujiong, HAN Xudong, et al. Operating condition classification of thermal power unit based on historical data clustering[J]. Chinese Journal of Scientific Instrument, 2019, 40(2): 90-95. [13] 张朝龙,何怡刚,袁莉芬,等. 基于核熵成分分析的模拟电路早期故障诊断方法[J]. 仪器仪表学报,2015,36(3): 675-684.ZHANG Chaolong, HE Yigang, YUAN Lifeng, et al. Approach for analog circuit incipient fault diagnosis based on KECA[J]. Chinese Journal of Scientific Instrument, 2015, 36(3): 675-684. [14] 惠永永,赵小强. 基于WICA-WGNPE的高斯-非高斯联合指标间歇过程监控[J]. 仪器仪表学报,2018,39(1): 190-199.HUI Yongyong, ZHAO Xiaoqiang. Batch process monitoring with Gaussian and non-Gaussian joint indicator based on WICA-WGNPE[J]. Chinese Journal of Scientific Instrument, 2018, 39(1): 190-199. [15] WANG H, JIN H, WANG J, et al. Optimization approach for multi-scale segmentation of remotely sensed imagery under k-means clustering guidance[J]. Acta Geodaetica et Cartographica Sinica, 2015, 44(5): 526-532. -

 下载:
下载:


 点击查看大图
计量
- 文章访问数: 882
- HTML全文浏览量: 468
- PDF下载量: 96
- 被引次数: 0