Delayed-Boarding Probability Distribution for Metro Stations Using Auto Fare Collection Data
-
摘要:
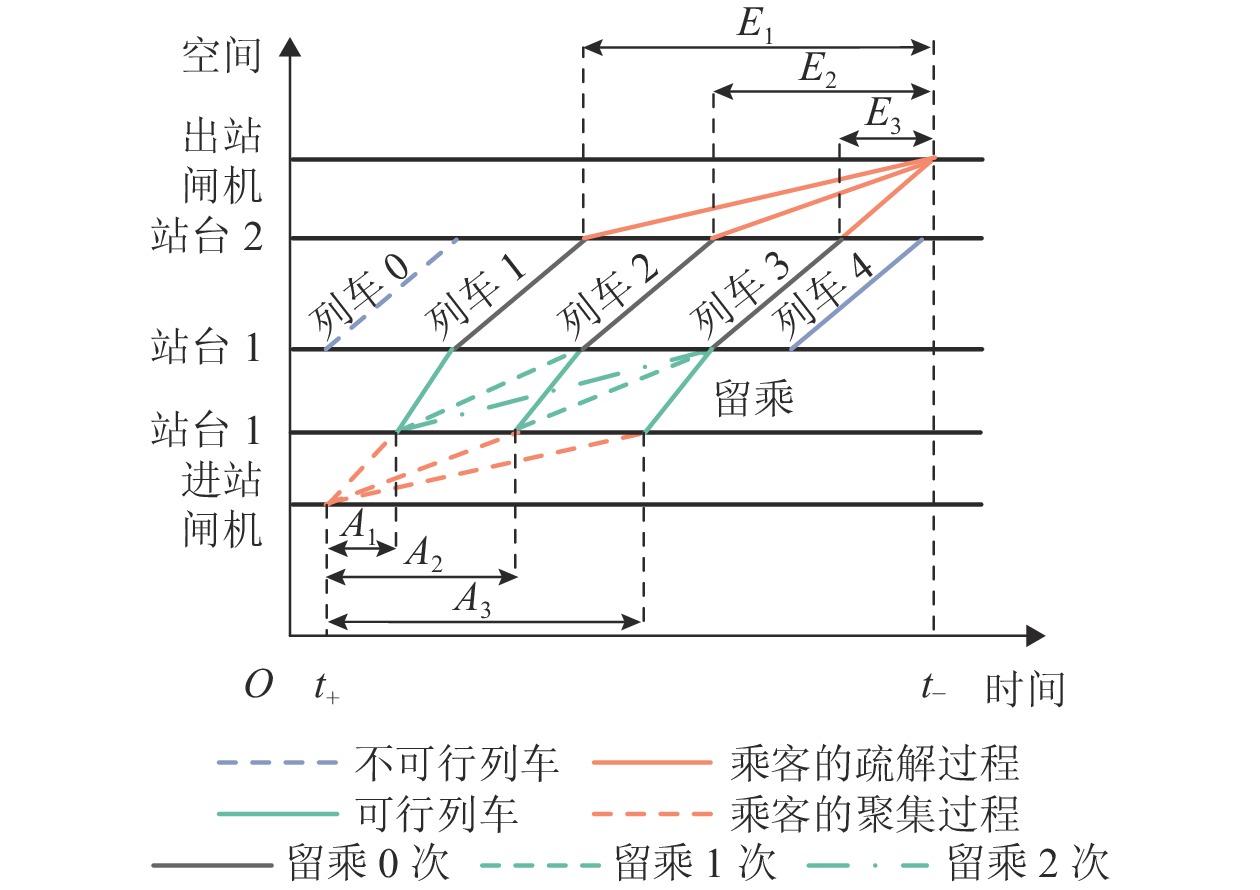
为研究地铁车站留乘特征,基于地铁自动售检票(auto fare collection, AFC)刷卡数据和运行图数据,研究了地铁车站留乘概率分布估计方法. 首先,基于乘客进、出站刷卡时刻与列车到、发时刻的关系,构造了聚集时间最大值、疏解时间的概率分布函数,提出了基于截断样本的聚集、疏解时间分布估计方法;其次,通过研究乘客进、出站刷卡时间、聚集时间、疏解时间及留乘次数间的关系,提出了地铁车站留乘概率分布估计方法;最后,以某地铁区段为例,在估计了留乘程度不同、类型不同车站的聚集、疏解时间分布的基础上,估计了这些车站在平峰、高峰时段内的留乘概率分布. 案例分析表明,在显著水平为5%的条件下,聚集、疏解时间分布估计结果可信;估计所得留乘概率分布与实地调查所得一致.
Abstract:To explore the characteristics of delayed boarding in metro stations, a probability distribution estimation method based on auto fare collection (AFC) data and operation timetable data is developed. Firstly, according to the relationship between passenger tap-in and tap-out time and train arrival and departure time, a probability distribution function of maximum access time and egress time is constructed, and an estimation method using the truncated sample is developed to estimate the access and egress time distribution. Secondly, an estimation method of the delayed-boarding probability distribution is constructed by analyzing the relationship among passenger tap-in and tap-out time, access and egress time and the number of delayed-boarding times. Finally, with some metro sections as a real case study, for different levels and types of stations, the access and egress time distribution and the delayed-boarding probability are estimated. The results of the case study show that the access and egress time distributions follow the estimated distributions at a 5% significant level, and the estimated delayed-boarding probability distribution is consistent with the practical results.
-
表 1 乘客的可能行程特征列示
Table 1. Features of feasible passenger itineraries
行程
编号聚集时间 留乘数/
次疏解
时间搭乘列车
编号1 $ [0,{T_{ - ,1}} - {t_ + }) $ 0 ${t_ - } - {T_{ + ,1}}$ 1 2 $ [0,{T_{ - ,1}} - {t_ + }) $ 1 ${t_ - } - {T_{ + ,2}}$ 2 3 $ [0,{T_{ - ,1}} - {t_ + }) $ 2 ${t_ - } - {T_{ + ,3}}$ 3 4 $ [{T_{ - ,1}} - {t_ + },{T_{ - ,2}} - {t_ + }) $ 0 ${t_ - } - {T_{ + ,2}}$ 2 5 $ [{T_{ - ,1}} - {t_ + },{T_{ - ,2}} - {t_ + }) $ 1 ${t_ - } - {T_{ + ,3}}$ 3 6 $ [{T_{ - ,2}} - {t_ + },{T_{ - ,3}} - {t_ + }) $ 0 ${t_ - } - {T_{ + ,3}}$ 3 表 2 部分车站的聚集、疏解时间分布参数估计值
Table 2. Estimated distribution parameters for access and egress time at stations
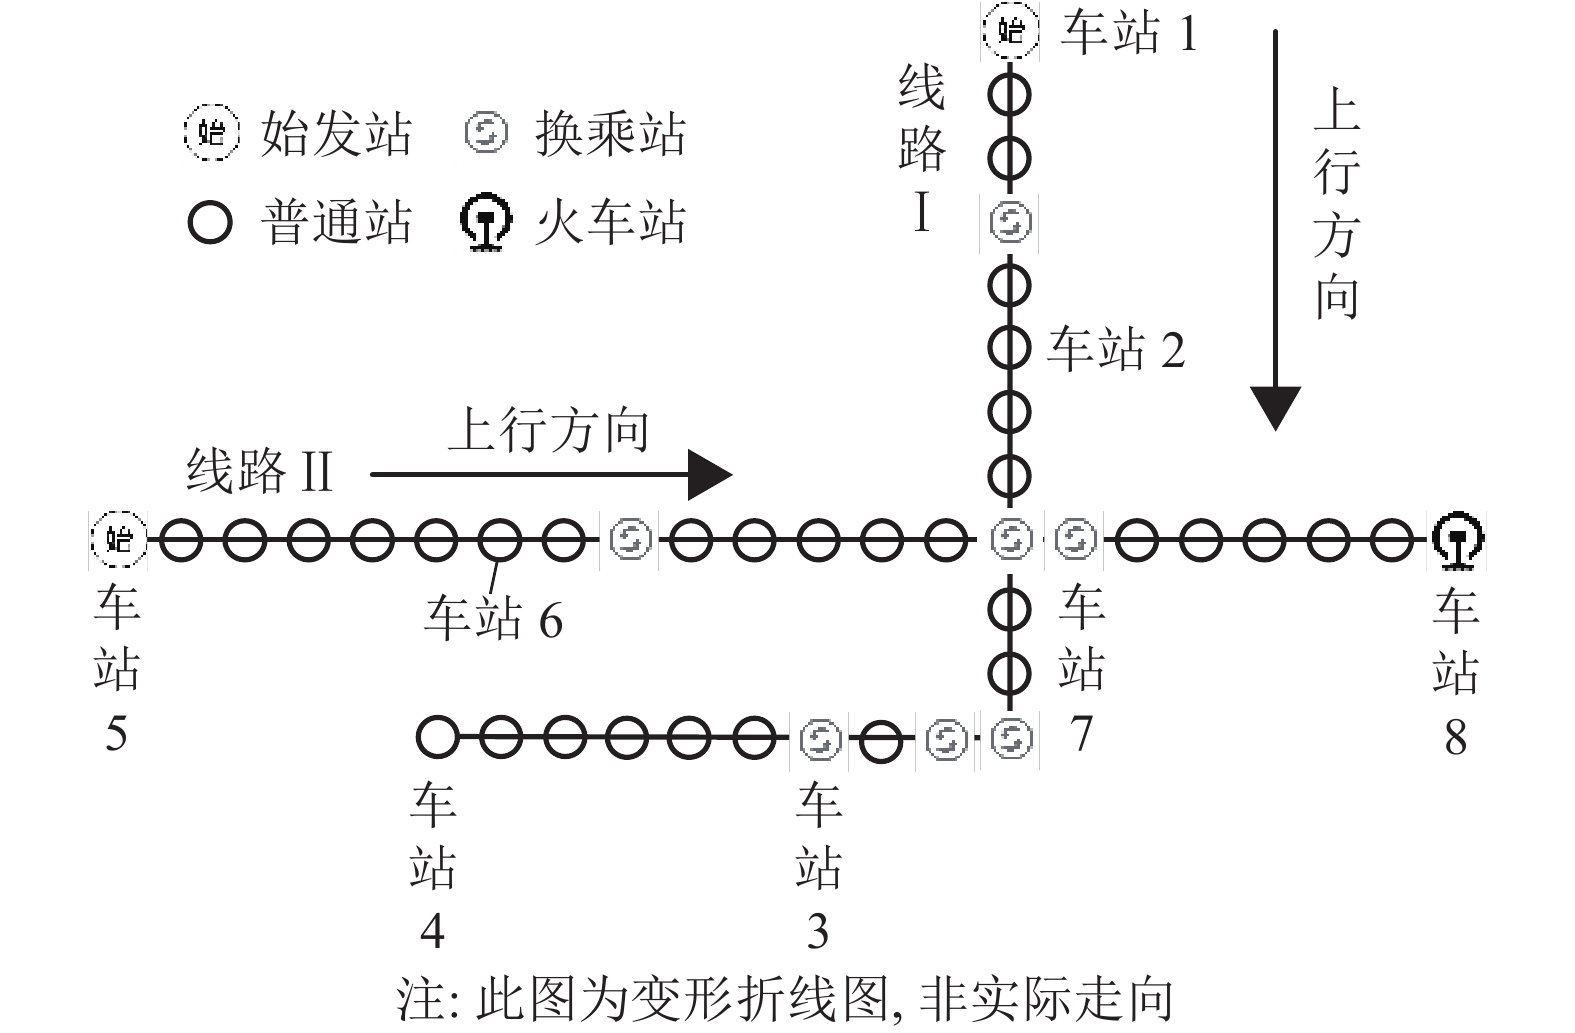
车站 聚集时间 疏解时间 ${\mu _{{\text{A}} ,s,d} }$ ${\sigma _{{\text{A}} ,s,d} }$ P 值 ${\mu _{{\text{E}},s,d} }$ ${\sigma _{{\text{E}},s,d} }$ P 值 1 89.57 20.28 0.32 2 99.45 40.45 0.15 101.26 39.73 0.67 3 127.99 41.61 0.06 149.72 42.36 0.83 4 10.23 8.73 0.53 5 127.17 44.14 0.12 6 57.40 26.43 0.98 63.82 27.86 0.99 7 155.66 36.59 0.13 161.99 50.42 0.97 8 110.04 26.73 0.36 表 3 不同时间段上行方向留乘概率分布参数估计与调查结果
Table 3. Estimated left-behind distribution parameters of delayed boarding and practical results in different periods
车站 时段 $ {\beta _{s,d,q,0}} $ $ {\beta _{s,d,q,1}} $ $ {\beta _{s,d,q,2}} $ $ {\beta _{s,d,q,3}} $ $ {\beta _{s,d,q,4}} $ $ {\beta _{s,d,q,5}} $ ${\beta _{s,d,q,6} }$ 估计 调查 估计 调查 估计 调查 估计 调查 估计 调查 估计 调查 估计 调查 1 高峰 08:30—09:00 0.974 1.000 0.003 0.022 平峰 15:30—16:00 0.996 1.000 0.004 2 高峰 08:30—09:00 0.712 0.720 0.164 0.140 0.105 0.110 0.013 0.030 0.005 平峰 15:30—16:00 0.997 1.000 0.002 0 3 高峰 08:30—09:00 0.002 0.030 0.014 0 0.076 0.060 0.254 0.280 0.528 0.490 0.118 0.120 0.007 0.020 平峰 15:30—16:00 0.962 0.980 0.027 0.020 0.008 0.020 5 高峰 09:00—9:30 0.842 0.870 0.125 0.127 0.007 0.003 0.014 0.006 0.005 平峰 20:00—20:30 0.925 0.931 0.074 0.069 0.001 0 6 高峰 09:00—9:30 0.985 0.980 0.013 0 0.002 0.003 平峰 20:00—20:30 0.997 1.000 0.002 0.001 7 高峰 16:30—17:00 0.910 0.940 0.055 0.060 0.024 0.012 0 平峰 09:00—09:30 0.997 0.990 0.003 0.010 -
[1] 张永生,姚恩建,刘莎莎,等. 城市轨道交通乘客半补偿路径选择建模与应用[J]. 铁道学报,2018,40(2): 1-7. doi: 10.3969/j.issn.1001-8360.2018.02.001ZHANG Yongsheng, YAO Enjian, LIU Shasha, et al. Metro passengers’ semi-compensatory route choice modeling and application[J]. Journal of the China Railway Society, 2018, 40(2): 1-7. doi: 10.3969/j.issn.1001-8360.2018.02.001 [2] 曾璐,刘军,秦勇,等. 基于 AFC 数据的突发事件下城市轨道交通乘客路径决策研究[J]. 铁道学报,2019,41(8): 9-18. doi: 10.3969/j.issn.1001-8360.2019.08.002ZENG Lu, LIU Jun, QIN Yong, et al. Route choice behavior of passengers in urban rail transit under emergency based on AFC data[J]. Journal of the China Railway Society, 2019, 41(8): 9-18. doi: 10.3969/j.issn.1001-8360.2019.08.002 [3] CATS O, HARTL M. Modelling public transport on-board congestion:comparing schedule-based and agent-based assignment approaches and their implications[J]. Journal of Advanced Transportation, 2016, 50(6): 1209-1224. doi: 10.1002/atr.1398 [4] 周玮腾,韩宝明. 考虑列车容量限制的地铁网络客流分配模型[J]. 华南理工大学学报 (自然科学版),2015,43(8): 126-134,143.ZHOU Weiteng, HAN Baoming. Passenger flow assignment model of subway networks under train capacity constraint[J]. Journal of South China University of Technology (Natural Science Edition), 2015, 43(8): 126-134,143. [5] ZHAO J J, ZHANG F, TU L, et al. Estimation of passenger route choice pattern using smart card data for complex metro systems[J]. IEEE Transactions on Intelligent Transportation Systems, 2017, 18(4): 790-801. doi: 10.1109/TITS.2016.2587864 [6] ZHU Y W, KOUTSOPOULOS H N, WILSON N H M. A probabilistic passenger-to-train assignment model based on automated data[J]. Transportation Research Part B:Methodological, 2017, 104: 522-542. doi: 10.1016/j.trb.2017.04.012 [7] ZHU W, WANG W, HUANG Z D. Estimating train choices of rail transit passengers with real timetable and automatic fare collection data[J]. Journal of Advanced Transportation, 2017, 2017: 5824051.1-5824051.12. [8] PAUL E C. Estimating train passenger load from automated data systems: application to London underground[D]. New York: Massachusetts Institute of Technology, 2010. [9] TIRACHINI A, SUN L J, ERATH A, et al. Valuation of sitting and standing in metro trains using revealed preferences[J]. Transport Policy, 2016, 47: 94-104. doi: 10.1016/j.tranpol.2015.12.004 [10] ZHU Y W, KOUTSOPOULOS H N, WILSON N H M. Inferring left behind passengers in congested metro systems from automated data[J]. Transportation Research Part C:Emerging Technologies, 2018, 94: 323-337. doi: 10.1016/j.trc.2017.10.002 [11] XIE X Y, LEURENT F. Comparison of passenger walking speed distribution models in mass transit stations[J]. Transportation Research Procedia, 2017, 27: 696-703. doi: 10.1016/j.trpro.2017.12.081 [12] LEURENT F, XIE X Y. Exploiting smartcard data to estimate distributions of passengers’ walking speed and distances along an urban rail transit line[J]. Transportation Research Procedia, 2017, 22: 45-54. doi: 10.1016/j.trpro.2017.03.006 [13] FULLER W A. Sampling statistics[M]. Hoboken: John Wiley & Sons, 2011. [14] HÖRCHER D, GRAHAM D J, ANDERSON R J. Crowding cost estimation with large scale smart card and vehicle location data[J]. Transportation Research Part B:Methodological, 2017, 95: 105-125. doi: 10.1016/j.trb.2016.10.015 [15] WOLYNETZ M. Algorithm AS 139:Maximum likelihood estimation in a linear model from confined and censored normal data[J]. Applied Statistics, 1979, 28(2): 195-206. doi: 10.2307/2346749 [16] YIN H D, WU J J, LIU Z Y et al. Optimizing the release of passenger flow guidance information in urban rail transit network via agent-based simulation[J]. Applied Mathematical Modelling, 2019, 72: 337-355. doi: 10.1016/j.apm.2019.02.003 [17] INGVARDSON J B, NIELSEN O A, RAVEAU S, et al. Passenger arrival and waiting time distributions dependent on train service frequency and station characteristics:a smart card data analysis[J]. Transportation Research Part C:Emerging Technologies, 2018, 90: 292-306. doi: 10.1016/j.trc.2018.03.006 -


 下载:
下载:


