Construction of Typical Driving Cycle for Tram
-
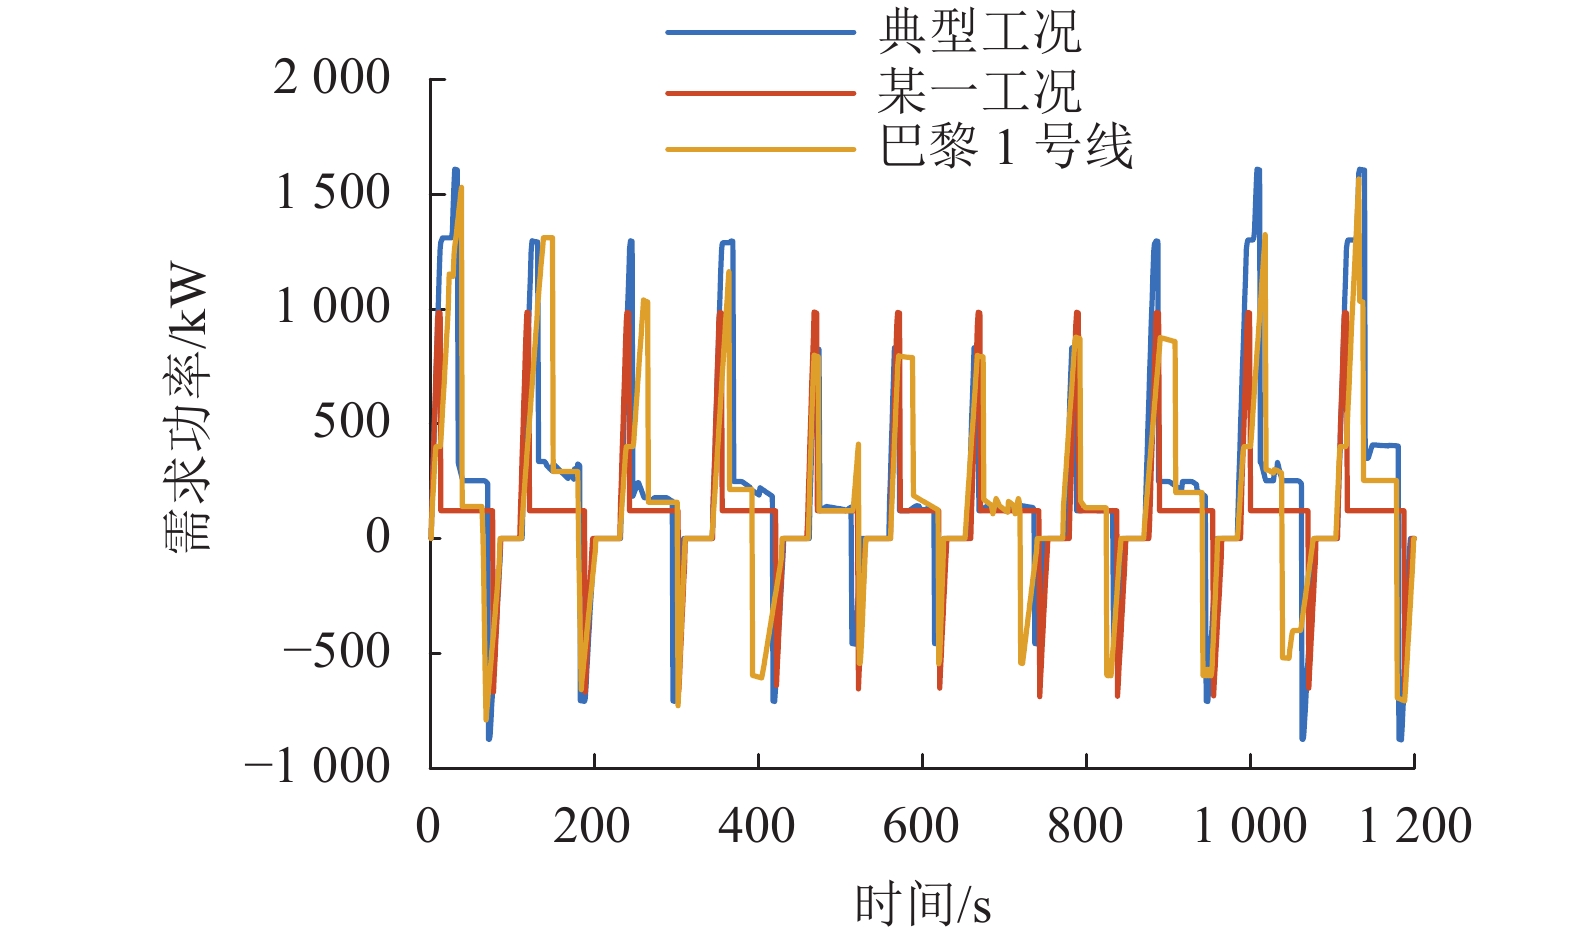
摘要: 为合理评估有轨电车在轨道交通中的行驶特征及运行指标,为有轨电车设计与控制提供依据,对有轨电车典型行驶工况进行构建. 首先,以巴黎、布达佩斯、墨尔本城市的有轨电车线路及行驶数据为基础,采用聚类方法获取降维行驶特征;然后,基于马尔可夫链理论,构建有轨电车典型行驶工况;最后,将构建工况与实际工况进行特征值对比分析,并基于所构建的典型工况进行仿真验证. 结果表明:构建的典型行驶工况与实际工况样本数据库总体特征的平均偏差仅为2.63%,满足偏差低于5%的开发精度要求;此外,典型行驶工况与实际行驶工况下的需求功率误差也仅为1.78%,验证了典型工况模型的准确性和有效性.Abstract: In order to reflect the real driving characteristics and operating parameters of new-energy trams in rail transit, and provide a basis for the design and control of trams, a typical driving cycle was constructed. Firstly, according to the tram operation data and tram lines in the cities of Paris, Budapest and Melbourne, the clustering analysis was used to obtain the driving features with dimensional reduction; and then the typical driving cycle based on Markov chain principle was built. Finally, a comparative analysis was made between the constructed typical tram driving cycle and the existing driving conditions, and the constructed typical driving cycle was validated by simulation. The results show that the average deviation of driving characteristic parameters between the constructed driving cycle and driving database population is 2.63%, which meets the development accuracy requirement, i.e., the deviation should be less than 5%. In addition, the demand power error under the typical driving cycle and actual driving cycle was only 1.78%, which verifies the accuracy of typical driving cycle.
-
Key words:
- driving cycle /
- tram /
- cluster analysis /
- Markov chain
-
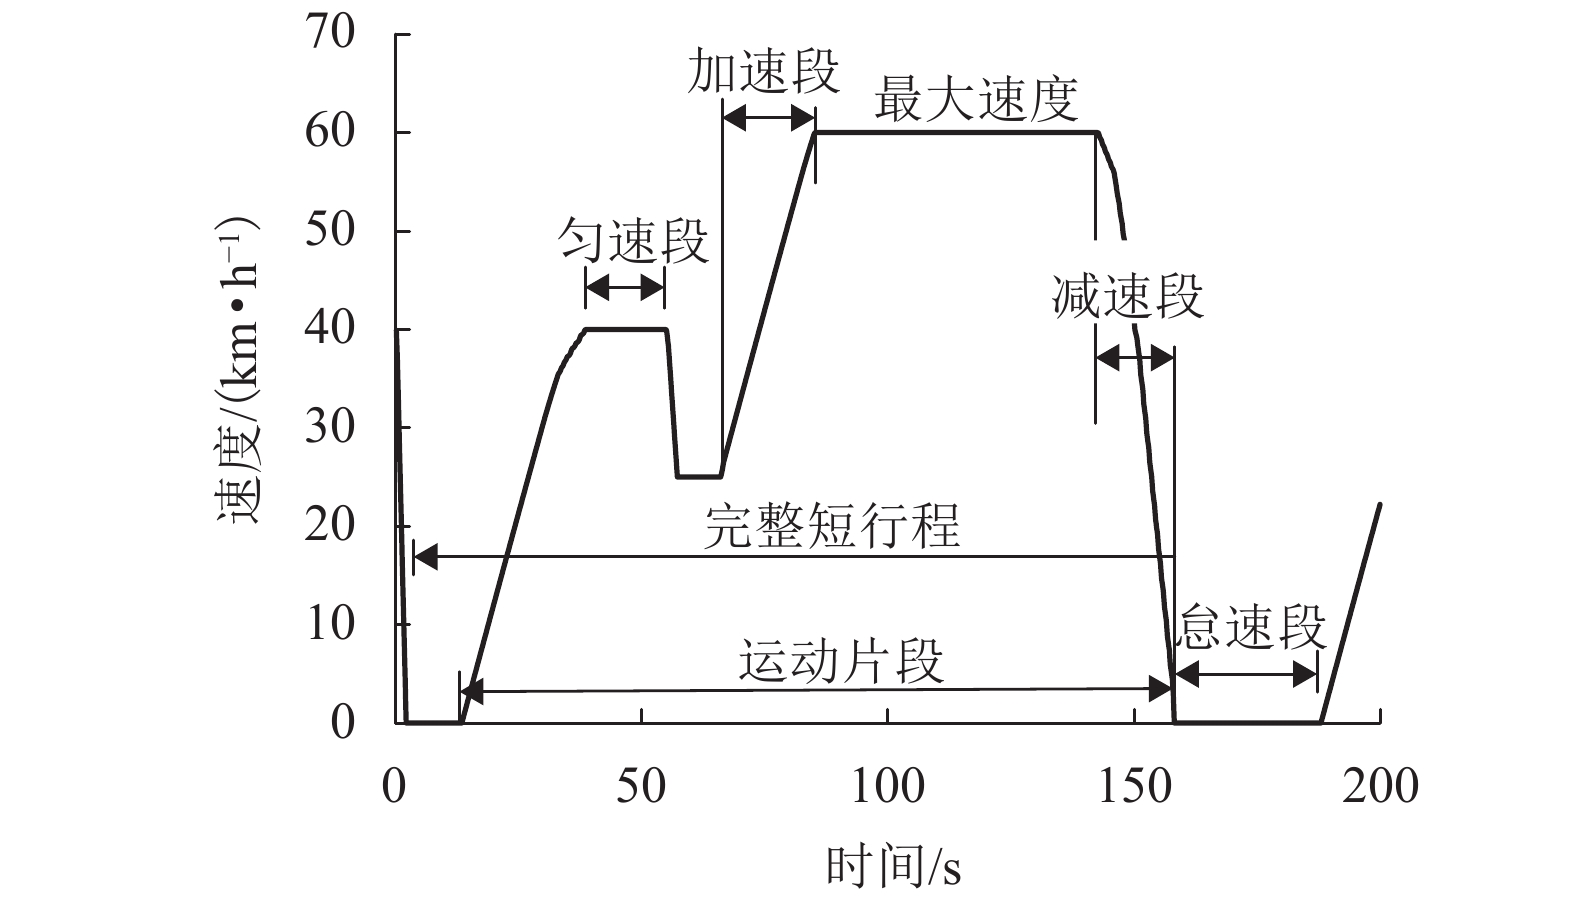
表 1 短行程特征参数
Table 1. Characteristic parameters of short stroke
符号 含义 符号 含义 Vavg/(km•h−1) 平均速度 V0-30 低速因子 Vstd/(km•h−1) 速度标准差 V30-70 中速因子 Vmax/(km•h−1) 最大速度 a0-0.5 低加速因子 aavg/(m•s−2) 平均加速度 a0.5-1 中加速因子 astd/(m•s−2) 加速度标准差 r0-0.5 低减速因子 amax/(m•s−2) 最大加速度 r0.5-1 中减速因子 rstd/(m•s−2) 减速度标准差 a= 0 匀速因子 ravg/(m•s−2) 平均减速度 tD/s 怠速时间 表 2 短行程样本数据库
Table 2. Database of short stroke samples
序号 Vavg/(km•h−1) Vstd/(km•h−1) ··· tD/s a= 0 1 34.98 22.40 ··· 29 20.30 2 28.81 20.89 ··· 31 3.84 $ \vdots $ $ \vdots $ $ \vdots $ $ \vdots $ $ \vdots $ 400 48.81 25.96 ··· 30 44.77 表 3 主成分特征值和贡献率
Table 3. Eigen values and contribution rates of principal components
主成分序号 主成分特征值 主成分贡献率/% 主成分序号 主成分特征值 主成分贡献率/% 1 7.355 4 45.97 9 0.105 9 0.67 2 3.890 3 24.31 10 0.061 8 0.39 3 2.190 2 13.69 11 0.052 5 0.33 4 0.759 7 4.75 12 0.037 8 0.24 5 0.481 3 3.01 13 0.030 0 0.19 6 0.390 5 2.44 14 0.026 8 0.17 7 0.322 4 2.02 15 0.015 5 0.10 8 0.274 4 1.72 16 0.005 5 0.03 表 4 短行程主成分得分矩阵
Table 4. Score matrix of short-stroke principal components
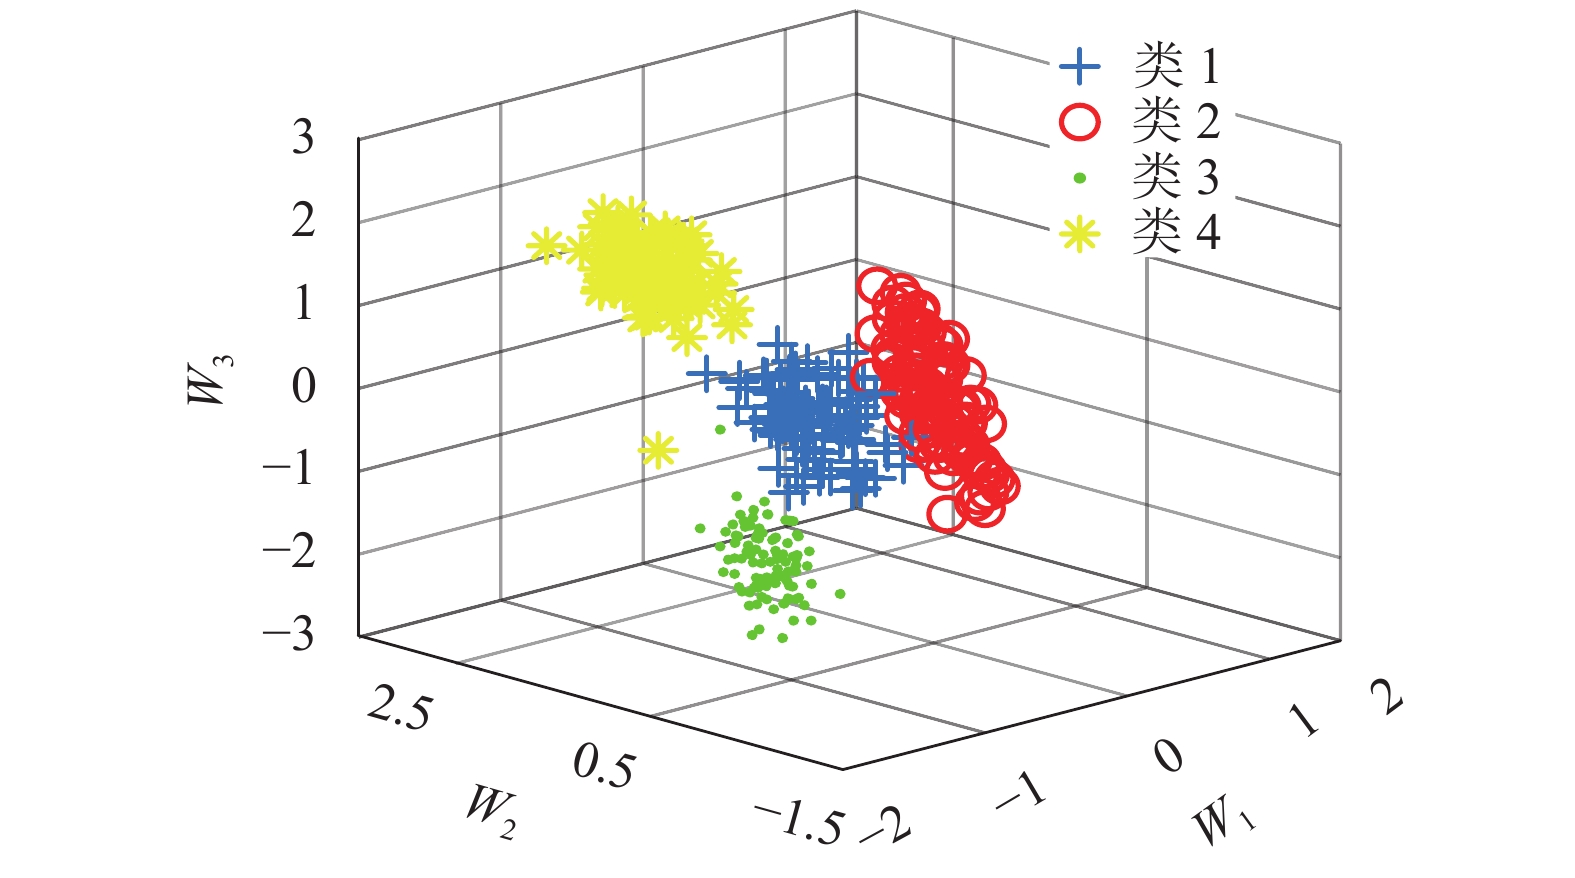
样本序号 T1 T2 T3 1 3.836 1.990 −0.206 2 4.467 2.133 −0.912 $ \vdots $ $\vdots$ $ \vdots $ $ \vdots $ 400 −1.853 1.410 2.026 表 5 聚类结果特征值对比
Table 5. Characteristic value comparison of clustering results
工况 样本占
比/%tD/s Vavg/
(km•h−1)Vmax/
(km•h−1)aavg/
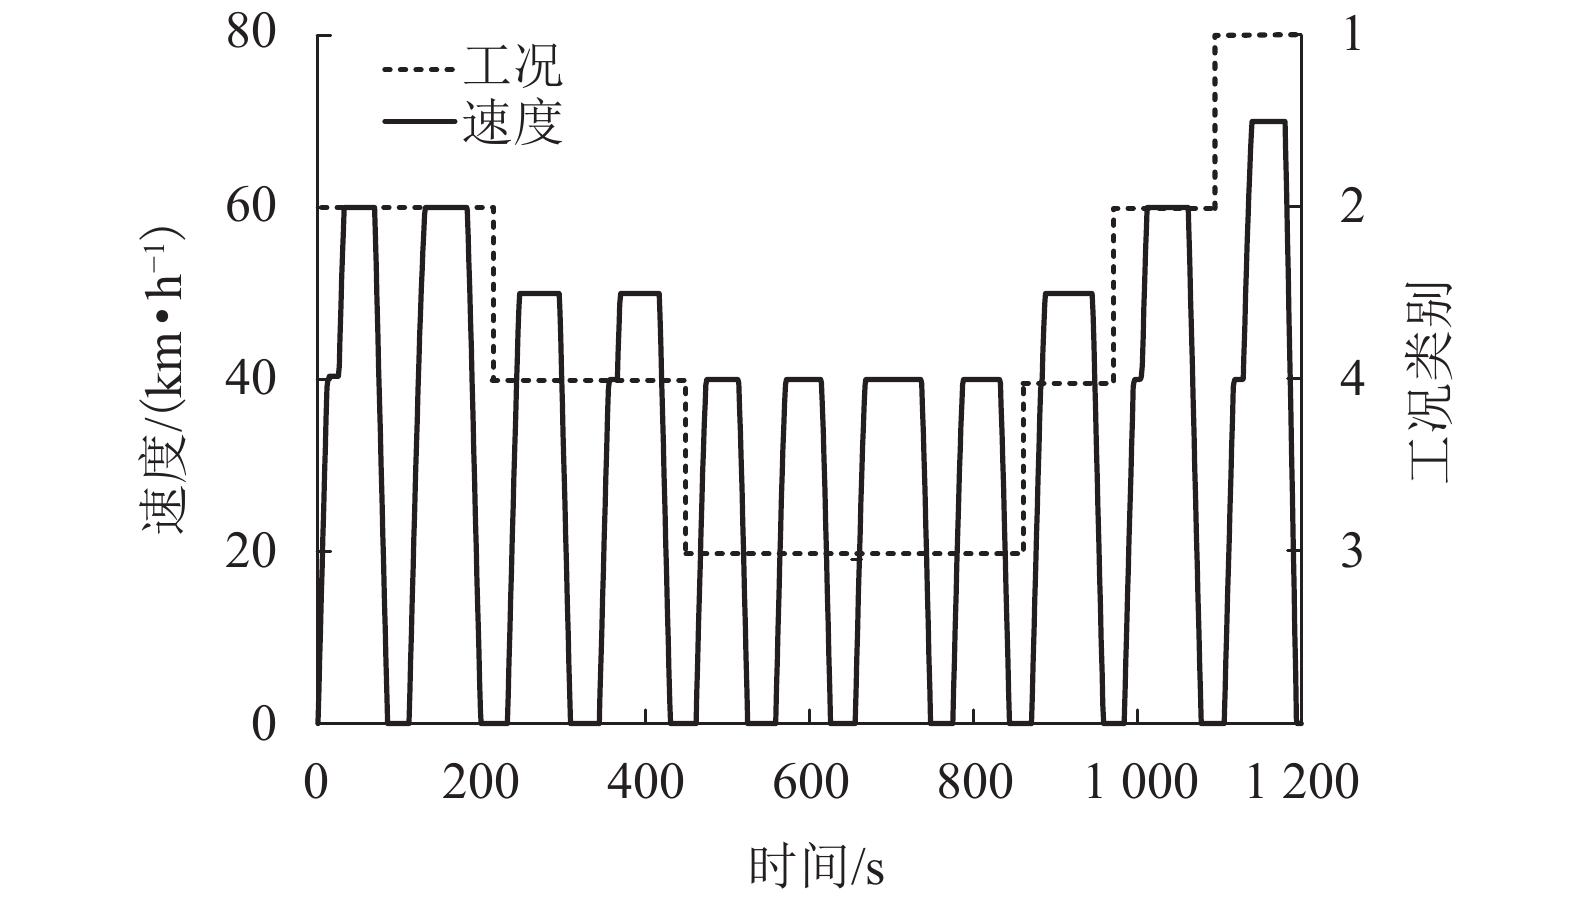
(m•s−2)V0-30 a=0 类1 10.3 23 51.9 70 0.91 16.1 47.1 类2 17.3 27 38.3 60 0.94 27.6 43.5 类3 27.6 30 23.4 38 0.91 64.0 53.2 类4 44.8 30 32.5 50 0.70 32.0 24.1 表 6 构建工况与数据库样本特征参数对比
Table 6. Comparison of characteristic parameters between constructed cycle and sample population
特征参数 样本总体 构建工况 绝对偏差/% Vavg/(km•h−1) 32.99 31.65 4.06 Vstd/(km•h−1) 18.52 18.81 1.56 Vmax/(km•h−1) 70 70 0 aavg/(m•s−2) 0.82 0.80 2.44 astd/(m•s−2) 0.19 0.18 4.58 amax/(m•s−2) 1.30 1.25 3.85 rstd/(m•s−2) 1.26 1.31 3.78 ravg/(m•s−2) −1.34 −1.40 4.24 V0-30 0.38 0.37 3.04 V30-70 0.62 0.63 1.90 a0-0.5 0.08 0.08 2.33 a0.5-1 0.15 0.16 1.93 r0-0.5 0.02 0.02 2.03 r0.5-1 0.01 0.01 1.78 a= 0 37.86 36.82 2.75 tD/s 28.76 29.29 1.84 -
OLATOMIWA L, MEKHILEF S, ISMAIL M S, et al. Energy management strategies in hybrid renewable energy systems:a review[J]. Renewable and Sustainable Energy Reviews, 2016, 62: 821-835. doi: 10.1016/j.rser.2016.05.040 BAÑOS R, MANZANO-AGUGLIARO F, MONTOYA F G, et al. Optimization methods applied to renewable and sustainable energy:a review[J]. Renewable & Sustainable Energy Reviews, 2011, 15(4): 1753-1766. 付稳超, 齐洪峰, 戴朝华, 等. 计及整车服役周期成本的有轨电车燃料电池混合动力系统配置优化方法[J/OL]. 西南交通大学学报: 1-9[2019-03-11]. http://kns.cnki.net/kcms/detail/51.1277.u.20181226.1123.010.html.FU Wenchao, QI Hongfeng, DAI Chaohua, et al. Optimal configuration method of tram fuel cell hybrid power system considering vehicle service cycle cost[J/OL]. Journal of Southwest Jiaotong University, 1-9[2019-03-11]. http://kns.cnki.net/kcms/detail/51.1277.u.20181226.1123.010.html. YAN Y, LI Q, CHEN W R, et al. Optimal energy management & control in multi-mode equivalent energy consumption of fuel cell/supercapacitor of hybrid electric tram[J]. IEEE Transactions on Industrial Electronics, 2018, 66(8): 6065-6076. TALLA J, STREIT L, PEROUTKA Z, et al. Position-based T-S fuzzy power management for tram with energy storage system[J]. IEEE Transactions on Industrial Electronics, 2015, 62(5): 3061-3071. doi: 10.1109/TIE.2015.2396871 BISHOP J D K, AXON C J, MCCULLOCH M D. A robust,data-driven methodology for real-world driving cycle development[J]. Transportation Research,Part D: Transport and Environment, 2012, 17(5): 389-397. SHI Q, ZHENG Y B, WANG R S, et al. The study of a new method of driving cycles construction[J]. Procedia Engineering, 2011, 16(1): 79-87. 姜平,石琴,陈无畏. 聚类和马尔科夫方法结合的城市汽车行驶工况构建[J]. 中国机械工程,2010,21(23): 2893-2897.JIANG Ping, SHI Qin, CHEN Wuwei. Construction of city vehicle driving conditions combined with clustering and Markov methods[J]. China Mechanical Engineering, 2010, 21(23): 2893-2897. BRADY J, O’MAHONY M. Development of a driving cycle to evaluate the energy economy of electric vehicles in urban areas[J]. Applied Energy, 2016, 177: 165-178. doi: 10.1016/j.apenergy.2016.05.094 曹骞,李君,刘宇,等. 基于大数据和马尔科夫链的行驶工况构建[J]. 东北大学学报(自然科学版),2019,40(1): 77-81.CAO Qian, LI Jun, LIU Yu, et al. Construction of driving cycle based on big data and Markov chain[J]. Journal of Northeastern University (Natural Science), 2019, 40(1): 77-81. 张曼,施树明. 面向汽车运行工况设计的马氏链非等长交叉进化算法[J]. 浙江大学学报(工学版),2018,52(9): 33-41.ZHANG Man, SHI Shuming. Non-isometric crossover evolution algorithm of Markov chain for designing vehicle driving cycles[J]. Journal of Zhejiang University (Engineering Science), 2018, 52(9): 33-41. MONTAZERIGH M, FOTOUHI A. Traffic condition recognition using the k-means clustering method[J]. Scientia Iranica, 2011, 18(4): 930-937. doi: 10.1016/j.scient.2011.07.004 NESAMANI K S, SUBRAMANIAN K P. Development of a driving cycle for intra-city buses in Chennai,India[J]. Atmospheric Environment, 2011, 45(31): 5469-5476. doi: 10.1016/j.atmosenv.2011.06.067 秦大同,詹森,漆正刚,等. 基于K-均值聚类算法的行驶工况构建方法[J]. 吉林大学学报(工学版),2016,46(2): 383-389.QIN Datong, ZHAN Sen, QI Zhenggang, et al. Driving cycle construction using K-means clustering method[J]. Journal of Jilin University (Engineering and Technology Edition), 2016, 46(2): 383-389. 胡志远,秦艳,谭丕强,等. 基于大样本的上海市乘用车行驶工况构建[J]. 同济大学学报(自然科学版),2015,43(10): 1523-1527.HU Zhiyuan, QIN Yan, TAN Piqiang, et al. Large sample based car driving cycle in Shanghai City[J]. Journal of Tongji University (Natural Science), 2015, 43(10): 1523-1527. 张宏,姚延钢,杨晓勤. 城市道路轻型汽车行驶工况构建[J]. 西南交通大学学报,2019(6): 1139-1146,1154.ZHANG Hong, YAO Yangang, YANG Xiaoqin. Study on light weight vehicles driving cycle construction based on urban roads[J]. Journal of Southwest Jiaotong University, 2019(6): 1139-1146,1154. 高建平,孙中博,丁伟,等. 车辆行驶工况的开发和精度研究[J]. 浙江大学学报(工学版),2017,51(10): 2046-2054.GAO Jianping, SUN Zhongbo, DING Wei, et al. Development of vehicle driving cycle and accuracy of research[J]. Journal of Zhejiang University (Engineering Science), 2017, 51(10): 2046-2054. 余曼,赵轩,魏朗,等. 基于FCM聚类算法的电动车城市循环工况构建[J]. 公路交通科技,2018,35(10): 144-153,162.YU Man, ZHAO Xuan, WEI Lang, et al. Construction of electric vehicle urban driving cycle based on FCM clustering algorithm[J]. Journal of Highway and Transportation Research and Development, 2018, 35(10): 144-153,162. 李永亮,张伟,戎亚萍. 现代有轨电车发展对我国的启示[J]. 交通运输系统工程与信息,2013(5): 206-210.LI Yongliang, ZHANG Wei, RONG Yaping. The enlightenment of modern tram’s development to China[J]. Journal of Transportation Systems Engineering and Information Technology, 2013(5): 206-210. -


 下载:
下载:


